Christopher B. Davis, Dickson Cheung, Richard Klasco, Kelly Bookman, Sean S. Michael, Richard Zane, Jennifer Wiler
Affiliation: Department of Emergency Medicine, University of Colorado Denver School of Medicine, Aurora, CO, USA
Corresponding Author: Christopher B. Davis, christopher.davis@ucdenver.edu
Keywords: Direct-to-consumer, Telemedicine, Virtual urgent care
Section: Research and Innovation
Background: Direct-to-consumer (DTC) virtual urgent care (VUC) visits are increasingly popular across both for-profit and nonprofit healthcare systems; however, few peer-reviewed studies have described the ecology of a VUC program.
Design/Setting: In this retrospective cohort study, patients (N = 2,216) received care through a VUC platform offered by a regional health system over an approximately 2-year period.
Results: Seventy-one percent of patients were identified as females. The age of the patients ranged from 18 to 85 years (median 39 years, interquartile range [IQR] 32–49 years). Eighty-four percent (n = 1,906) of patients had a registered primary care provider (PCP), while 177 (8%) chose to self-pay for the VUC service. Seventy-six percent of visits occurred between Monday and Friday, and 71% (n = 1,573) visits occurred between 8 am and 6 pm. The median provider response time was 24 minutes. Visits were conducted by videoconference 84% of the time; providers and patients spent a median of 7.4 minutes (IQR 4.3, 9.9 min) together in the video room. Seventy-seven percent of visits generated a prescription, of which 70% were on antibiotics.
Conclusions: Most virtual visits were initiated by existing health system patients with a primary care physician, and the majority of patients sought care during usual business hours. Most visits led to a prescription, most commonly an antibiotic. These data can help inform operational leaders who are considering how best to structure, staff, and develop key performance indicators for their own VUC programs. Additionally, these data challenge the notion that acute, episodic DTC encounters occur after-hours and are utilized by uninsured patients who lack a relationship with a primary care physician.
As healthcare continues its transformation from a volume- to a value-based system, healthcare leaders are challenged to shape the value equation by increasing quality and lowering the cost. Telemedicine’s explosive growth can be attributed to the promise that it can increase access and decrease cost without sacrificing quality or patient satisfaction.1 Accordingly, the telehealth industry is expected to grow nearly 15% annually through 2025 to become a $2.8 billion market.2
Direct-to-consumer (DTC) telemedicine involves a patient-initiated medical encounter typically facilitated by videoconference or secure messaging technology.3 These visits can be synchronous or asynchronous. DTC telemedicine adoption is growing rapidly, especially in the segment of acute, episodic, unscheduled care (i.e. virtual urgent care [VUC]).4,5 The majority of these visits have historically been hosted through private, for-profit companies, such as Doctor on Demand™ and American Well™. However, as the technology enabling DTC telemedicine becomes more affordable, reliable, and more easily integrated into the electronic health record (EHR), more health systems will undoubtedly pursue their own DTC VUC platforms to serve their patient populations. One limitation to adoption, however, is the lack of available data on patient demographics, utilization patterns, and basic performance metrics. These data are necessary to drive practice management decisions such as how to best structure and staff a DTC telemedicine service line.
In this study, we outline our experience implementing a DTC VUC. We present the demographic trends seen in our cohort of virtual visits and describe utilization patterns and basic performance metrics. Our goal is to use these descriptive data to highlight a common set of operational decisions for those health systems considering a DTC VUC venture.
This investigation was a retrospective cohort descriptive study. An Institutional Review Board approved this protocol and waived the requirement of informed consent (COMIRB # 17-1300).
This study occurred through a large integrated hybrid academic community healthcare system. In late 2016, the health system developed a DTC VUC service line embedded within the patient portal of its electronic health platform (Epic Systems Corporation, Verona, Wisconsin). Patients could request evaluation for a discrete set of complaints, including sinusitis, cold/flu, urinary tract infections (UTIs), cough, sore throat, pink eye, rash, other (limited only to January 2, 2017 through July 15, 2017), diarrhea, allergic reaction, cuts/scrapes, and vomiting.
During the study period, patients were treated by board-certified or board-eligible emergency physicians in over 98% of encounters (the remainder were treated by family medicine physicians). Between January 2 and June 30, 2017, virtual visits were covered by providers on a rotating on-call schedule; between July 1 2017 and January 22, 2019, the VUC was staffed by providers working a concurrent shift in a local freestanding emergency department (FSED). If a patient was unable to connect by video, then the visit was conducted by phone if clinically appropriate.
The VUC platform was structured on native functionality within the EHR. To access the platform, patients first had to authenticate their identity through a digital patient portal (MyChart, Epic Systems Corporation, Verona, Wisconsin). Patients without an existing account could register for one in real time. Patients could access the VUC platform either through a web browser or through the health system’s mobile application. Patients were not required to separately download and install Vidyo software to complete their visit (Vidyo, Inc, Hackensack, New Jersey). After authentication, patients completed an e-check in process to verify demographics, select their preferred pharmacy, and completed a complaint-specific questionnaire. Patients then selected an appointment time (available 24/7 and most often within the next hour) using native online scheduling functionality. Patients could then select to utilize either a $49 self-pay option, or choose to utilize their health insurance for their VUC visit. Once the e-check in process was complete, a link for “Join Video Visit” became available to patients within the digital patient portal. This radio button joined patient and provider within a uniform resource locator (URL) linked to Vidyo and unique to the patient encounter with the EHR. After completion of the VUC, after-visit instructions were sent electronically to the patient via the patient portal.
Once a patient scheduled a VUC visit, an alert was paged to a health system call center agent. The call center agent then assigned the encounter to a provider covering the VUC that day. The agent accomplished this by placing the VUC encounter in the provider’s schedule using Epic Cadence functionality. The agent then called the provider to confirm availability. Just prior to the visit, the provider would log into the VUC department within the EHR to review pertinent medical history along with the pre-visit questionnaire. The link to the unique video room was available to the provider embedded within the EHR, and could then be accessed either through a web browser or through Epic Haiku/Canto. Once the video visit had been completed, the provider then documented within the EHR using a video visit note type. Embedded within this note were attestations necessary for insurance reimbursement, such as patient location and visit modality. Providers could then e-prescribe any non-controlled medications appropriate for the visit and route these medications to a pre-identified pharmacy. Providers were also instructed to route the record of the visit to the primary care provider (PCP) via the EHR.
This study included any patient 18 years or older who received an evaluation through the health system’s VUC between January 2, 2017 and January 22, 2019. No patients were excluded from analysis.
Demographic data extracted from the EHR included age, gender, self-pay status, presence or absence of a PCP, and whether a patient was new to the health system.
We extracted visit data including chief complaint, discharge diagnosis, time in the video room, any prescriptions generated from the virtual visit, and provider response time. Provider response time was defined as the difference between when a patient submitted a request for a virtual visit and when the patient and provider were both present in the video room. As patients could select future appointment times within the same calendar day, provider response time over 60 minutes was excluded from response time analysis. If a patient was treated in the VUC, visit modality was characterized as video or telephone.
Database management and descriptive analyses were conducted using JMP 13.2 (SAS Institute, Cary, North Carolina).
Between January 2, 2017 and January 22, 2019, there were 2,216 patients treated through the VUC, of whom 1,573 (71%) were identified as females. Their age ranged from 18 to 85 years (median 39 years, interquartile range [IQR] 32–49 years). Ninety-four percent of patients (n = 2,127) had previous in-person encounters within the health system, while 259 (12%) had previously used the VUC platform. Eighty-four percent (n = 1,906) had a registered PCP, while 177 (8%) chose to self-pay for the VUC service. A summary of visits organized by chief complaint is shown in Table 1.
Table 1. Summary of VUC encounters (N = 2,216; female, 71%; median age, 39 years; range, 18–85 years) between January 2, 2017 and January 22, 2019
| Diagnosis | % |
|---|---|
| Sinusitis | 21 |
| Cold/Flu | 19 |
| Urinary tract infections | 16 |
| Cough | 12 |
| Sore throat | 8 |
| Conjunctivitis | 6 |
| Rash | 6 |
| Other* | 4 |
| Diarrhea | 3 |
| Allergic Reaction | 2 |
| Cuts/Scrapes | 2 |
| Vomiting | 1 |
*Other conditions included an unstructured questionnaire for “general medical conditions”—patients requested care for anxiety, back pain, chest pain, depression, dizziness, ear pain, erectile dysfunction, hiccups, vaginal bleeding, vaginal discharge, and yeast infection. No condition in this category is >1% of total visits.
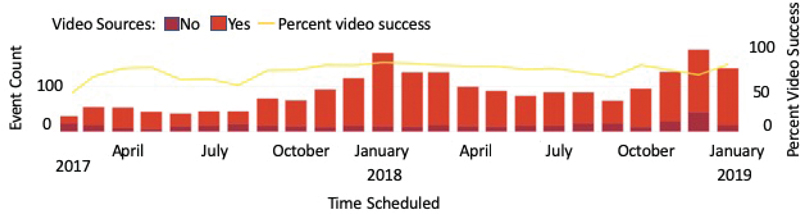
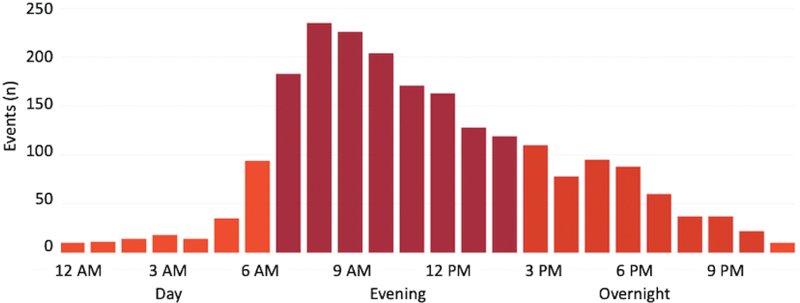
A majority of visits (n = 1,684; 76%) occurred between Monday and Friday, while 71% (n = 1,573) visits occurred between 8 am and 6 pm. Figure 1 demonstrates demand for virtual visits by time of day, while Figure 2 demonstrates seasonal variation in VUC visits and charts the longitudinal video connection success rate over time. Twenty-nine percent (N = 643) of patients chose an appointment time greater than 1 hour from when they submitted their request for a virtual visit.
Figure 1—Virtual urgent care visit demand by time of day.
Figure 2—Virtual urgent care visit demand and video connection success by month.
The overall median provider response time was 24 minutes. Median provider response time by on-call providers was 21 minutes, while median response time using providers working concurrently at health system FSED was 25 minutes. Visits were conducted through videoconference 84% of the time; providers and patients spent a median of 7.4 minutes (IQR 4.3–9.9 minutes) together in the video room. A prescription was generated after a VUC visit 77% of the time, and an antibiotic was prescribed after a virtual visit 54% of the time. Antibiotics comprised 70% of total prescriptions written.
Many health systems are considering DTC VUC service lines to expand reach and remain competitive in a healthcare environment undergoing rapid change. In this study, we report retrospective data from 2 years of VUC visits to highlight trends and patterns that can be used to inform operational and practice management decisions common to organizations considering DTC VUC programs. These considerations include which clinical services to offer, which hours to staff a DTC VUC service line and by whom, and how to identify key performance indicators (KPIs).
Operational leaders should be able to answer the fundamental question of “who are my patients?” In our cohort of VUC encounters, we observed several surprising trends. First, the average patient age was 40 years, with a range of 18–85 years of age. Clearly, telemedicine is not only for millennials, and there is strong demand for the convenience of digital health solutions among older patients. Anecdotally, we remark that older patients require more technical support to join the video room, and operational leaders should anticipate this need.
Gender differences were also striking. Women were overrepresented by a ratio greater than 2:1 compared to men. We suspect this observation is driven by several factors, some of which can be explained by opportunity. As noted in Table 1, UTIs represented a large proportion of visits, and the overwhelming majority of UTI encounters were requested by female patients. However, even after excluding encounters for UTI from the overall cohort, female patient encounters remain nearly double those requested by male patients.
It is also important to note that marketing of the VUC platform was limited only to the health website and within the patient portal itself. Previous studies suggest that women are more likely to utilize patient portals compared with men.6 It stands to reason that higher utilization of the VUC by women may be driven at least in part by higher adoption rates for patient portals.
Furthermore, recent studies suggest that women have less leisure time than men, but women are also responsible for making approximately 80% of healthcare decisions for a given family.7,8 It is also possible that women have a higher demand for healthcare services where convenience is a priority. More study is necessary to understand the gender disparity observed for utilization of the VUC platform.
Finally, we note that encounters in this cohort were typically generated by patients with a preexisting relationship with our health system, and most of them attempted to use a third-party payer rather than self-pay. Further study is necessary to understand the patient incentives driving the choice to use a VUC platform over more traditional models of care, but these observations call into question the dogma that VUC patients may lack access to a PCP.
Our health system made an operational decision to offer VUC services 24/7 to maximize access and opportunity. This obviously comes with the trade-off of higher staffing costs. Before launch, we anticipated that utilization might be highest during the evening hours and on weekends, when access to one’s primary care physician might be more limited. Despite the availability of this service at any hour, it is notable that the majority of visits occurred during traditional business hours (Figure 1).
It remains unclear whether this trend is driven by a lack of capacity for same-day PCP appointments, or alternatively, the flexibility of a virtual visit simply allows patients to receive healthcare services without disrupting their daily obligations at work or home. These utilization data have relatively intuitive implications on when to staff a DTC virtual service line. Operational leaders will have to make a decision as to whether the benefit of increased access through round-the-clock coverage can be justified, or whether lower staffing costs and simplified scheduling are a more important priority.
It is also worth noting that in our model we utilized emergency physicians concurrently working at relatively low volume FSEDs for the majority of these visits. There is considerable overlap between VUC utilization and typical ED arrivals.9 In our experience, this highlights a vulnerability in the staffing model strategy to use providers with concurrent brick-and-mortar clinical obligations. If a provider is pulled away to perform traditional care, back-up providers must be available to meet the expectation of timely service for virtual visits. Virtual visit demand also appears to be seasonal (Figure 2). Peak demand is in the winter months, which correspond with higher incidences of influenza and other viral illnesses. Not surprisingly, these months tend to be busier in brick-and-mortar locations as well.
The median amount of time the patient and provider spent together in the video room was 7.4 minutes, and 90% of visits were completed in fewer than 15 minutes. Some visits were considerably faster, but queuing theory suggests that the large coefficient of variation around visit times potentially poses a risk of delays if some visits take more time. Consequently, we would suggest that allocating 15 minutes per encounter allows for contemporaneous documentation that can be used as a reasonable base unit for the work effort required for DTC VUC visits.
It is worth noting that a significant proportion of patients chose an appointment time greater than 1 hour from when the patients initially submitted their virtual visit request. This highlights the importance of having this type of scheduling functionality within a system’s telemedicine platform, as all patients do not want a “next available” appointment time.
DTC VUC visits are a power and flexible tool, which can be applied to a variety of clinical scenarios. However, we advise operational leaders to tailor the clinical scope of their virtual service line to solve a particular problem, such as increasing access or decreasing higher cost healthcare utilization. This clinical scope decision is nuanced and should consider the type of technology (video vs. phone vs. secure chat), the reimbursement model (fee-for-service vs. value-based care), and provider type (PCPs vs. predominantly acute care providers, physician vs. advanced practice provider).
By way of example, in a value-based or population health reimbursement environment, a virtual triage model with a broad clinical scope may add the most value because it allows direction of patients to appropriate level of care at the lowest cost. In a predominantly fee-for-service environment, a more narrow and lower acuity clinical scope may be appropriate so that the majority of visits do not require referral to a higher level of care. In our case, operational leaders chose the latter strategy and structured our VUC around a discrete number of clinical conditions (Table 1), which could be safely managed without the benefit of ancillary laboratory or radiographic testing. This chief complaint list largely mirrors those offered by privately owned national DTC companies. UTIs, sinusitis, and cold/flu represented the three most commonly requested services, none of which typically implicitly require in-person testing or referral to a physical location. It is worth noting that we initially allowed patients to request a virtual visit under an “other” category, but we found that a disproportionately high number of these visits required a higher level of care. We therefore removed this chief complaint option after an initial trial period.
Whether to offer the option for medication refills through acute, episodic virtual visits is worthy of special consideration. As an integrated medical system where the EHR facilitates easy review of medication and problem lists, it was operationally tempting to offer virtual medication refills out of shear convenience for the patient. However, given that our VUC was staffed primarily by emergency physicians, we ultimately felt such an offering would sabotage the relationship between patient and PCP and ultimately cannibalize our own primary care visit volume. Furthermore, acute care providers often lack the training or experience to assess long-term medication effectiveness and appropriateness, and PCPs can provide much more value in this area. We felt that such an offering could additionally undermine the change management and socialization efforts required to successfully launch a DTC VUC program within a healthcare system.
Any high functioning service line must identify key performance indicators to measure performance and incentivize quality. However, to date there is no accepted standard for which KPIs are most critical to a DTC VUC. The decision of which KPIs to measure, therefore, becomes a reflection of the operational priorities of leaders. Our organization has chosen to focus on provider response time, video success rates, antibiotic utilization, and patient experience. We chose these KPIs for the following reasons: (1) provider response time reflected the importance of timely service for a program founded on convenience; (2) a successful video connection was critical to our ability to leverage third-party payer reimbursement, and (3) tracking antibiotic utilization rate is critical for antibiotic stewardship, and overuse of antibiotics is a common criticism of both traditional urgent care and VUC.10–12
What did we observe? The median provider response time, which is measured as the time from when a patient requested a virtual visit through the digital portal to when the patient joined the video room with the provider, was 24 minutes. During the study, we utilized two different staffing models. We initially launched our VUC service using an “on call” model where providers were paid a stipend to field virtual visit requests. The median response time for this staffing structure was 21 minutes. In July 2017, we transitioned to leveraging emergency physicians working at low census emergency departments or FSEDs. Using this staffing model, our response time was 25 minutes, or 19% slower. Ultimately, operational leaders must make a trade-off between using a resource truly dedicated to virtual care delivery and a more expensive or leveraging an existing in-person provider resource at the potential cost of less timely service.
In Colorado, a telemedicine parity law enables reimbursement by third-party payers (with the exception of Medicare) for virtual visits into the patient’s home. A successful connection via video is therefore critical for revenue generation and also serves as a proxy for how intuitive the virtual care platform is for both patients and providers. Figure 2 shows longitudinal data on the percentage of visits completed using live-interactive video. Our initial video connection rates began at just over 50%. This low rate was likely driven by a number of factors, which are discussed next.
First, when we initially launched this service, we focused on a self-pay population where video success was not directly linked to reimbursement. This is the reimbursement model commonly used by for-profit DTC telemedicine companies. Second, the entire system was novel to patients and providers alike; this unfamiliarity likely led to an increased rate of video connection failure. Third, because we utilized an on-call staffing model during our initial launch, this introduced the added variable of additional hardware such as personal laptops and smartphones, which represented a technical point of weakness for the system.
Despite these challenges, video connection rates improved rapidly as providers adapted to the technology. The dip in connection rates in the summer of 2017 corresponds to the on-boarding of new providers concurrently working in our emergency departments (Figure 2). We observed the highest video success rates (above 90%) when these providers were familiar with the platform and when dedicated workstations were utilized for the visits rather than personal devices.
It is worth noting that 100% video connection success rate is aspirational; in a DTC model, patients are inherently reliant on their own device and Internet connection; this reliance introduces technical limitations such as outdated operating software or limited cellular or Internet connection speeds. Finally, while we tracked longitudinal video connection success rates, short-term or outlier video connection trends serve as a useful bellwether for instability in the virtual care platform itself.
As discussed earlier, we feel that tracking antibiotic utilization is critical to the long-term success of VUC. In this cohort, an antibiotic was prescribed in 54% of encounters. An appropriate external benchmark for this cohort of complaints is not available, although our antibiotic utilization rates for sinusitis are published separately and compare favorably to brick-and-mortar urgent cares.10 However, measuring antibiotic utilization will facilitate future efficacy studies that utilize tools such as clinical decision support or provider incentive plans in an effort to lower antibiotic utilization.
The data included in this study are descriptive and were generated through a telemedicine platform integrated into the health system’s EHR. Readers should therefore remain cautious when generalizing these data to different clinical or technical care environments. There are also a number of local environmental factors that drove both tactics and strategy; other health systems facing different competitive landscapes, reimbursement pressures, and legislative backdrops may naturally come to different conclusions.
This study describes our early experience using a DTC VUC platform within a hybrid academic community health system. Most virtual visits were initiated by existing health system patients with a PCP, and the majority of patients sought care during usual business hours.
These data challenge the notion that acute, episodic DTC encounters occur after-hours and are utilized by uninsured patients who lack a relationship with a primary care physician. Most visits led to a prescription, most commonly an antibiotic. Operational leaders must choose a staffing model which balances the trade-offs between cost, reliability, and efficiency. Operational leaders should focus their quality efforts on specific key performance indicators, such as timeliness of service and antibiotic appropriateness.
The authors received no funding or grant support to conduct this study.
The authors report that they have no conflicts of interest.
Drafting of the manuscript was done by CBD, DC and SSM. Critical revision of the article was performed by CBD, RK, KB, RZ and JW. Approval of the final manuscript was done by CBD and JW.
| 1. | Hertz BT. Telemedicine: Patient demand, cost containment drive growth. Joining the trend may not be as expensive or time-consuming as you think, experts say. Med Econ. 2013;90:37, 9–42. |
| 2. | Finley BA, Shea KD. Telehealth Disrupting Time for Health Care Quantity and Quality. Nurs Admin Q. 2019;43(3):256–262. https://doi.org/10.1097/NAQ.0000000000000357 |
| 3. | Elliott T, Shih J. Direct to consumer telemedicine. Curr Allergy Asthma Rep. 2019;19:1. |
| 4. | Reed ME, Parikh R, Huang J, Ballard DW, Barr I, Wargon C. Real-time patient–provider video telemedicine integrated with clinical care. N Engl J Med. 2018;379:1478–9. |
| 5. | Barnett ML, Ray KN, Souza J, Mehrotra A. Trends in telemedicine use in a large commercially insured population, 2005–2017. J Am Med Assoc. 2018;320:2147–9. |
| 6. | Goel MS, Brown TL, Williams A, Hasnain-Wynia R, Thompson JA, Baker DW. Disparities in enrollment and use of an electronic patient portal. J Gen Intern Med. 2011;26:1112–6. |
| 7. | Matoff-Stepp S, Applebaum B, Pooler J, Kavanagh E. Women as health care decision-makers: Implications for health care coverage in the United States. J Health Care Poor Underserved. 2014;25:1507–13. |
| 8. | Mattingly MJ, Bianchi SM. Gender differences in the quantity and quality of free time: The U.S. experience. Social Forces. 2003;81:999–1030. |
| 9. | Kang SW, Park HS. Emergency department visit volume variability. Clin Exp Emerg Med. 2015;2:150–4. |
| 10. | Davis CB, Marzec LN, Blea Z, et al. Antibiotic prescribing patterns for sinusitis within a direct-to-consumer virtual urgent care. Telemed J E Health. 2019;25(6):519–22. https://doi.org/10.1089/tmj.2018.0100 |
| 11. | Uscher-Pines L, Mulcahy A, Cowling D, Hunter G, Burns R, Mehrotra A. Access and quality of care in direct-to-consumer telemedicine. Telemed J E Health. 2016;22:282–7. |
| 12. | Palms DL, Hicks LA, Bartoces M, et al. Comparison of antibiotic prescribing in retail clinics, urgent care centers, emergency departments, and traditional ambulatory care settings in the United States. JAMA Intern Med. 2018;178:1267–9. |
Copyright Ownership: This is an open access article distributed in accordance with the Creative Commons Attribution Non Commercial (CC BY-NC 4.0) license, which permits others to distribute, adapt, enhance this work non-commercially, and license their derivative works on different terms, provided the original work is properly cited and the use is non-commercial. See: http://creativecommons.org/licenses/by-nc/4.0.