Agni Kumar1, Nancy Hung1, Yuhan Wu2, Robyn Baek3, Amar Gupta4
Affiliations: 1Electrical Engineering and Computer Science Department, Massachusetts Institute of Technology (MIT), Cambridge, MA, USA; 2Biological Sciences Department, Wellesley College, Wellesley, MA, USA; 3SOC Telemed, Reston, VA, USA; 4Institute for Medical Engineering and Science & Computer Science, Artificial Intelligence Lab, and Electrical Engineering and Computer Science Department, MIT, Cambridge, MA, USA
Corresponding author: Agni Kumar, Massachusetts Institute of Technology, Departments of EECS, Mathematics, Email: agnik@mit.edu
Keywords: Alteplase, Evidence-Based Care, Predictive Modeling, rt-PA Telemedicine, Stroke, Teleneurology, t-PA
Section: Original Clinical Research
Introduction: Emergency teleneurology care has grown in magnitude, impact, and validation. Stroke is a leading cause of death in the United States, and timely treatment of stroke results in better outcomes for patients. Teleneurology provides evidence-based care to patients even when a board-certified neurologist is not physically on site. Determining staffing demand for telemedicine consultation for a specific period of time is an integral part of the decision-making activities of providers of acute care telemedicine services. This study aims to build a forecasting model to predict consultation demand to optimize telemedicine provider staffing. Such forecasting models acquire added importance in emergency situations such as the current COVID-19 pandemic.
Materials and methods: This study trained consultation data of SOC Telemed, a private telemedicine provider, from 411 hospitals nationwide and involving 97,593 incidents of consultations. The forecasting model analyzes multiple characteristics, including hospital size (number of beds), annual volume, patient demographics, time of consultation, and reason for consultation.
Results: Several regression techniques were used to demonstrate a strong correlation between these features and weekly demand with R2 = 0.7821. Reason for consultation in the past week was the strongest predictor for the demand in the next week with R2 = 0.7899.
Conclusion: A predictive model for demand forecasting can optimize telemedicine resources to improve patient care and help telemedicine providers decide how many physicians to staff. The goal of the forecasting model is to improve patient care and outcomes by providing physicians timely and efficiently to meet the consultation demand. The ability to predict demand and calculate expected volume allows telemedicine providers to schedule physicians in advance. This mitigates the clinical risk of excess patient demand and long waiting time, as well as the financial risk of scheduling a surplus of physicians.
Telemedicine is the delivery of healthcare services in situations where the physician and patient are not at the same geographic location.1 Telemedicine relies on three closely coordinated components: healthcare tasks performed by humans on-site, healthcare tasks performed by humans off-site, and healthcare tasks performed by computers without direct human involvement.1
Teleneurology is a medical specialty within telemedicine. It can exist as a local hub or facility connected electronically to a larger hospital, neurologist, or specialist to provide consultations.2 For example, for SOC Telemed, an American telemedicine company, the audiovisual conferencing equipment consists of a camera with pan, tilt, and zoom capabilities, allowing the neurologist to examine and speak to the patient in a hospital. Teleneurology consultations include diagnosing and treating headaches, dementia, strokes, multiple sclerosis, and epilepsy. The hospital’s emergency department physician refers patients to a teleneurologist by calling SOC Telemed to initiate a consultation.
In spite of advances in stroke treatments, stroke remains the fifth most common cause of death and the leading cause for long-term adult disability, worldwide. Brain damage is directly correlated with time, because a patient with ischemic stroke typically loses 1.9 million neurons, 14 billion synapses, and 12 km of myelinated fibers every minute that blood is not flowing into the brain.3 Approximately, 87% of acute strokes are ischemic—a situation involving a blood vessel carrying blood to the brain being blocked by a blood clot.4 Patients with ischemic stroke are generally good candidates for intravenous (IV) alteplase (Acteplase®, tissue plasminogen activator, t-PA, rt-PA), a thrombolytic agent that helps reverse or prevent disability from ischemic stroke if administered within 3 hours—a guideline recommended timeline window for thrombolytic therapy according to the American Stroke Association.5 Alteplase IV is the only thrombolytic agent approved by the Food and Drug Administration for acute ischemic stroke.6 The time between stroke and patient receiving alteplase is inversely correlated with chances for recovery with no or minimal deficits. However, if misdiagnosed, administering alteplase in a hemorrhagic stroke patient poses severe risks to the patient’s life.
High patient numbers, limited specialized expertise, and geographic determinants remain major barriers that negatively impact implementation of evidence-based stroke management.7 At the same time, the shortage of neurologists is only exacerbating the existing barriers. Between 2012 and 2025, the demand for and the supply of neurologists are estimated to increase by 3,260 and 1,694, respectively. The supply of neurologists was already short by 1,814 neurologists in 2012, and by 2025, the shortage will increase to 3,380 neurologists.8 Teleneurology consultations serve an important role in bridging the shortage of neurologists and expanding access to care, so that patients can receive life-saving diagnosis and treatments in a timely manner.9
Teleneurology forecasting differs from traditional emergency demand forecasting in that teleneurology providers need to provide service 24/7 to accommodate patients’ needs at any given time, with some requiring a response time of 5 minutes or less. Teleneurology provides the hospital and patient immediate access to expertise around alteplase administration, considerably shortening door-to-needle time. Door-to-needle time, which is defined as the time between a patient entering the hospital to when the “clot-busting” alteplase drug is administered, is one of the key measurements in neurology. The benchmark “door-to-needle” time for stroke is set at 60 minutes, while many centers have exceeded this benchmark with median times ranging from 20 to 51 minutes.10–15 Teleneurology is demonstrated to be associated with reductions in “door-to-needle” time for alteplase.16–18 Several studies reveal that teleneurology improves alteplase use and outcomes in ischemic stroke in rural areas and community hospitals.19–22
Given that thrombolytic treatments are decided upon in an urgent manner, clinicians have shown growing interest in using teleneurology to treat stroke patients. Teleneurology can be initiated by the clinician at the hospital, and telemedicine enables an instantaneous and private conversation between neurologists, patients, and clinicians. Ideally, teleneurology operational and service hours should be provided at all times year-round. Determining how many physicians to staff for teleneurology consults in a given period of time is therefore an integral part of the decision-making activities of providers of acute care telemedicine services.18,23 Without knowing an expected teleneurology consult request volume, telemedicine providers are at the mercy of physicians’ availability and are blindly scheduling physician shifts to cover as many hospitals as possible for 24/7 coverage. In addition, physicians are staffed on a monthly cadence, which adds further complexity to the scheduling problem without foresight of the projected demand.
The availability of good demand forecasts can lead to more effective allocation of human and physical resources to minimize patient care delays and improve the overall quality of healthcare.24 Teleneurology particularly benefits patients who are located in remote or rural areas, to provide equal and timely access to optimal stroke services across geographic regions and the care continuum.25
Existing models employed to forecast patient demand consist of regression-based forecasting models such as linear,26–28 logistic29,30 and Poisson regression.31 Apart from regression-based models, time series methods have been used to forecast patient demand. Within time-series analyses, Auto Regressive Integrated Moving Average (ARIMA)32–38 modeling and exponential smoothing (ES)39–41 are applied most commonly. Machine learning algorithms such as Support Vector Machine (SVM),42 neural networks,28,43,44 and Bayesian networks45 have also been used. In particular, the models we propose in this paper are highly interpretable, as they use a small number of important input features based on a priori knowledge that can be formalized as a priori relevance, and incorporate simple internal processing involving understandable rules, instead of complex learning processes associated with neural networks. Due to the sparse nature of our data, we did not employ rigorous nonregression models, as this could lead to sparse data bias.46
In summary, this work proposes a weekly and monthly forecasting model on teleneurology consultation demand. Regression techniques such as ridge and lasso regression are applied. The model elucidates factors that affect the return on investment for telemedicine services, thus providing a valuable insight to telemedicine service providers.
Data from SOC Telemed, a private telemedicine provider, was used for this research. The dataset covered 411 hospitals nationwide and 97,593 incidences of teleneurology consultations from July 2015 to January 2018, where each row of data was timestamped at the minute level. We aggregated the data on a weekly and monthly basis to create the training data used for our models. This dataset was collected through SOC Telemed’s documentation software and documented by the call center agents and neurologists.
When a consultation is requested by a hospital’s clinician, SOC Telemed’s call center agent receives the call and begins documenting information about the patient and reason for consultation. Then, SOC Telemed’s neurologist begins the teleconsultation with the patient and documents clinical notes, including diagnosis and treatment recommendations. Within teleneurology, 53,000 female patients (55%) received consultations, compared to 43,000 (45%) male patients. Geographically, the dataset shows a heavier representation of hospitals in the Southeast, accounting for 35% of the total number of clients. Consultations were predominantly focused on stroke, followed by transient ischemic attack (TIA), encephalopathy, seizures, and stroke requiring tPA administration.
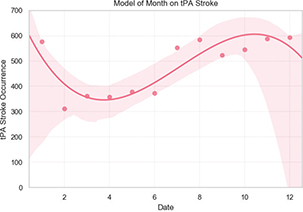
Although alteplase stroke did not occur with high frequency, it is the condition with the highest acuity due to the time-sensitive need for precise care.47 If patients arrive at the emergency department too late, they cannot be given alteplase as the treatment would be less effective. No correlation was found between gender and tPA stroke.48,49 A normal-like distribution was found between age and tPA stroke, with median centered around the 61- to 70-year age group.50,51 Using polynomial regression fitting, alteplase administration and the months of the year follow a cubic relationship with R2 = 0.7821, as shown in Figure 1. This demonstrates seasonality in our data on a monthly basis, which is an expected trend. A slightly higher influx of patients was observed for fall and winter months, compared with those of spring and summer months. The number of patients who experienced stroke in this population varies between 311 in March and peaks at 593 in December. Although there are historically mixed results on the relationship between seasonality and stroke occurrences,50,51 a meta-study cites that 48.4% of studies evaluated on stroke reported higher occurrences of stroke during fall and winter months, whereas 39% of studies observed the opposite trend.52 Thus, seasonality may be present in the data.
Figure 1—PA administration varies polynomially based on time of year.
Ordinary least squares (OLS) linear regression and polynomial regression models were applied to search for correlations between features and demand. Ridge regression and the lasso were also tested to find the best fit model. Ridge regression was applied for fine-tuning the complexity of the model with a regularization term, while lasso regression suits sparse data by forcing the sum of the absolute value of the regression coefficients to be less than a fixed value, causing certain coefficients to be set to zero and reducing the problem to a simpler model that does not include those coefficients.53 Plots depicting the weekly and monthly telemedicine service demand aggregated across all partnering hospitals, over a period of approximately 1 year, are shown in the figures below.
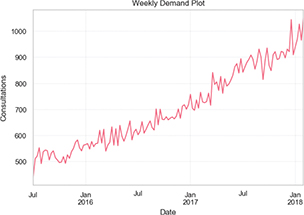
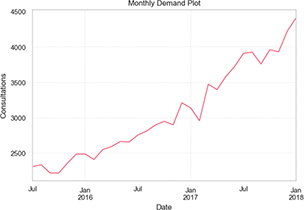
In Figure 2, the data are aggregated on a weekly basis and plotted against the number of consultations that occurred during that week. The weekly demand (Figure 2) ranges from around 440 consultations in early July 2015 to 1051 consultations in late January 2018, showing that demand for telemedicine services has steadily increased over this time period. The correlation between number of consultations and data collected on a monthly time interval (Figure 3) also demonstrates a similar upward trend. Consultations range from 2220 in October 2015 to 4415 in January 2018. Demand is noted to spike slightly around the holiday periods. In the monthly demand plot (Figure 3), dips and peaks are observed once or twice a month.
Figure 2—Weekly telemedicine service demand.
Figures 2 and 3 depict the weekly and monthly telemedicine service demand aggregated across all partnering hospitals, over a 1-year period. The weekly data and monthly data comprise aggregations of minute-level data collected between January 2017 and February 2018. Aggregations at the monthly level reveal the slight presence of seasonality within monthly demand due to the fluctuations on a monthly basis, in line with the trend associated with tPA administrations in Figure 1. Thus, across time, the tPA administration rate is fairly constant.
Figure 3—Monthly telemedicine service demand.
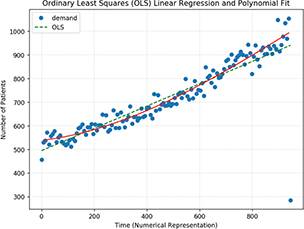
OLS regression output demonstrated a slope of 0.202485 with y-intercept value as 845.707773 and correlation coefficient as 0.0357 (Figure 4). The time axis is given in the days elapsed since the start of data collection in January 2017. The low correlation coefficient output prompted running a model with additional input variables. Several orders of fitted polynomials were explored. Training, testing, and cross-validation were then executed to generate accuracy scores, whose values were no longer highly variable in successive iterations due to augmentations of independent variables set in the system. Care was taken to minimize overfitting.
Figure 4—Linear and polynomial fits on weekly aggregated demand.
OLS linear regression was used to find the coefficient values that maximize R2 and minimize the sum of squared residuals. OLS gives a coefficient for each predictor provided, including terms with little predictive power, a model has low bias but high variance results. We have the potential to improve our model by trading some of that variance with bias to reduce our overall error. This trade comes in the form of regularization, in which we modify our cost function to restrict the values of our coefficients.
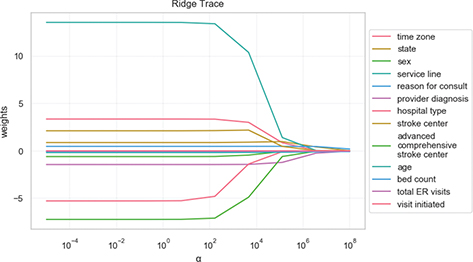
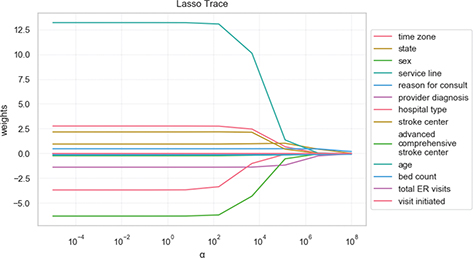
After experimentation, it was observed that a slight change to the model’s input arguments yielded relatively large changes in the outputted weights. Ridge (Figure 5) and lasso regressions (Figure 6) were set to a specific regularization (α) to reduce this variation. In particular, lasso regression adds an additional term to the cost function, namely, the sum of the coefficient values multiplied by a constant (α). This additional term penalizes the model for having coefficients that do not explain a sufficient amount of variance in the data. It also has a tendency to set the coefficients of bad predictors to zero, which makes lasso useful in feature selection. Ridge regression also adds an additional term to the cost function, but instead sums the squares of coefficient values and multiplies it by some constant α. Compared to lasso regression, this regularization term decreases the values of coefficients but is unable to force a coefficient to exactly zero. This makes ridge regression’s use limited with regard to feature selection, but it in turn is able to select groups of highly correlated features. When α is very large, the regularization effect dominates the squared loss function, causing the coefficients (each in a different color on the plot) to tend to zero. From these figures, we observe that as α tends toward zero and the solution toward OLS, coefficients vary widely. In both plots, the faster a coefficient is shrinking, the less important it is for prediction.
Figure 5—Ridge coefficients as a function of the regularization.
Figure 6—Lasso coefficients as a function of the regularization.
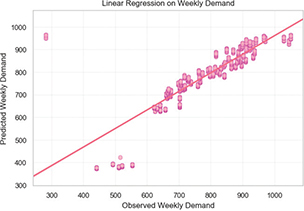
Features used to train the new regression models were: time zone, visit initiated, state, gender, age, service line, reason for consult, provider diagnosis, hospital type, bed count, stroke certifications by level, and total ER visits to predict telemedicine consultations (Figure 7). Running the linear regression on these features, most of the data points matched the predicted value with R2 = 0.7821 (Table 1). Lasso regression on the same features yielded an R2 of 0.7695, a value slightly less than that associated with OLS Linear Regression. Ridge regression on all inputs yielded slightly better results with an R2 = 0.7829 (Table 2) and provided the best overall result. This result was expected because ridge regression penalizes incorrectly trained and labeled predictions.
Table 1 Results for linear, ridge, and lasso regression models
| Regression | I Results | Rank of Performance |
|---|---|---|
| Ridge | r2 = 0.7829 | 1 |
| Linear (OLS) | r2 = 0.7821 | 2 |
| Lasso | r2 = 0.7695 | 3 |
OLS, ordinary least squares.
Figure 7—Visualization of relation between measured and predicted demand.
Executing the weekly prediction linear regression model with just Provider Diagnosis, the model yielded R2 = 0.7433. Using the same model with Service Line in place of Provider Diagnosis, the accuracy increased to R2 = 0.7698. Weekly prediction with only Reason for Consult performed the best, even better compared to training all the features together with R2 = 0.7899. Interestingly, weekly forecasting with Reason for Consult and Provider Diagnosis increased the model accuracy to R2 = 0.8057. While it was expected that Reason for Consult and Provider Diagnosis would yield good results, it was unexpected that the Service Line would also provide an equally good prediction (Table 2).
Table 2 Key fields, example fields, and descriptions used in data analysis
| Field | Field Definition | Example Categories | Definition of Categories |
|---|---|---|---|
| Reason For Consult | Reason for initiating telemedicine consultation | TIA | Transient Ischemic Attack |
| Acute ischemic stroke | Requires brain imaging for diagnosis within 60 min in order to intervene | ||
| Migraine | Throbbing/pulsing head pain | ||
| Tremor | involuntary and rhythmic shaking9 | ||
| Provider Diagnosis | Clinical diagnosis from telemedicine consultation | Stroke/tPA Stroke | Stroke that requires tPA administration |
| Seizure | Sudden, uncontrolled electrical disturbance in the brain10 | ||
| Encephalopathy | Brain degeneration likely caused by repeated head traumas11 | ||
| Migraine | Throbbing/pulsing head pain | ||
| Service Line | Immediacy for consultation scheduling | Neuro Routine | Middle priority |
| Neuro Emergency | Highest priority | ||
| Neuro Routine — Scheduled | Lowest priority | ||
TIA: transient ischemic attack, tPA: tissue plasminogen activator
This study was envisaged to predict future teleneurology consultation demand with the objective of optimizing hospital staffing to reduce both financial risk for telemedicine providers and clinical risks for patients. The analysis demonstrates a strong correlation between the month and week of a telemedicine consultation request and the predicted number of consultations using linear, ridge, and lasso regression models.
The combination of input features, such as hospital characteristics, and consult characteristics, which include Provider Diagnosis, Service Line, and Reason for Consult, yielded forecasted consults demand, with 78% overall accuracy with ridge regression. Overall, this weekly and monthly prediction model informs how to staff providers on their monthly schedules for SOC Telemed’s needs. Furthermore, the model can be adjusted to address changes in environment. For example, COVID-19 has significantly diminished the volume of teleneurology consultation. Instead of using the past year’s data, we could shorten the time frame of data to as little as a couple of weeks to reflect and adapt to the rapidly changing environment.
Ongoing work includes improving the accuracy of the current predictive model by augmenting each training vector with the Service Line, Reason for Consult, and Provider Diagnosis. We will continue to work around dataset limitations, which include the dataset consisting entirely of data from one telemedicine provider and its clients, for a single practice, only over a 1-year time period. Ideally, we would like more information on the extent to which telemedicine was used in consults over various hospitals, patient demographics data (to analyze which hospitals get greater telemedicine service demand and if this is correlated with patient demographics), and notes of which partnering hospitals specialize in which service lines. Noting that the spikes and dips in demand over the year are not dramatic, we look to incorporate an anomaly detection component into the model, to search specifically for points and microtrends that impact the demand for telemedicine service the most at specific points over time.
Planned future work includes performing predictions on different time scales, such as a model that looks for trends on a daily cadence instead of weekly or monthly. Although the weekly and monthly models are more aligned with the real-world use case, daily fluctuations could facilitate insights on providing a more granular model for staffing resources.
Accurate personnel forecasting is more important in teleneurology settings because of the higher prevalence of alteplase administration in teleneurology, compared to traditional neurology. A case study on a hospital’s alteplase use showed that IV alteplase increased from three to 34 administrations from 2009 to 2018.54 This study found that the increase in consultations and IV alteplase coincides with the adoption of teleneurology. From April 2019 through March 2020, SOC Telemed’s teleneurologists administered alteplase to 3,271 patients out of 6,548 acute ischemic stroke patients who presented to emergency departments with time last known well of 4.5 hours or less, indicating a 50% alteplase administration rate. Therefore, teleneurology service is an effective way to provide emergency consultations to hospitals of different demographics.48 In rural areas, the alteplase administration rates have increased to 55% when teleneurology is offered as an option.49 In 2014, data from Massachusetts General Hospital (MGH) website showed that 207 out of 532 stroke consults over telemedicine received IV alteplase as compared to a 4% national rate.55
Teleneurology provides a potential solution to address the shortage of neurologists, and the demand predictive model for consultations is helpful for telemedicine providers in this context.56 For neurology, estimates for the number of physicians required per 100,000 population ranges between 1.4 and 2.3.57 These ratios are used as a starting point to assess the community need for physicians. The supply of neurologists is predicted to grow by 11% between now and 2025, while demand is projected to grow by 16%.58
Teleneurology treatment is highly cost-effective, particularly for severe stroke.17,59 The incremental cost-effectiveness ratio is $108,363/quality-adjusted life year (QALY) in the 90-day horizon and $2,449/QALY in the lifetime horizon.59 Teleneurology is also demonstrated to be more patient-specific, sensitive, and to have higher predictive values than traditional telephone-based consultations.60 Alteplase IV delivery through teleneurology networks is safe and effective in the 3-hour time window.61–63 Teleneurology services are performed as reliably as bedside neurologists.59,64,65
Teleneurology is recommended by the American Heart Association and American Stroke Association in instances when specialists are not available in person.66 Based in part on the experience with the current COVID-19 pandemic, we believe strongly that these guidelines should and will be applicable to all situations. In fact, one of the co-authors of this paper is aware of a hospital that caters to potential cases of stroke both on on-site basis and via telemedicine. The available response time for the neurologist to advise the patient (from the time that the request was initiated) is actually lower in the telemedicine case, as a neurologist is always on duty around the clock. In the other case, it takes time for the neurologist to walk from other duties to see the concerned patient or to come from home during nighttime.
This research could be used as a foundation to study telemedicine consultations involving other medical specialties. Furthermore, patient demographics data could be incorporated to identify hospitals with greater telemedicine service demand and to test whether demand is correlated with patient demographics. Considering that the spikes and dips in demand over the year are not dramatic, an anomaly detection component could be incorporated into the model to search for microtrends affecting telemedicine service demand at certain time points.
The authors thank Hai Tran, Chief Operating Officer (COO) and Chief Financial Officer (CFO) at SOC Telemed, for delivering a guest lecture for the Telemedicine and Telehealth for Enhancing Global Health course at Massachusetts Institute of Technology (MIT), for sparking brainstorming discussions on ways to enhance and optimize telemedicine consultation demand, and for providing valuable insights into the day-to-day operations of the largest US provider of acute care telemedicine services. We also thank Dr Rafael Palacios (Visiting Scholar, MIT Energy Initiative) for comments and suggestions on the evolving manuscript. This paper originated from a student paper that was written as part of the above course, developed and taught at MIT in 2018, 2019, and 2020, which provided a unique opportunity to learn from visionaries in industry, academia, and government on strategic, medical, policy, technical, business, legal, and economic aspects of telehealth. The authors are grateful for the inputs and suggestions from the diverse base of distinguished group of speakers and participants in the course, whose ideas have been incorporated in this paper.
Apart from the disclosure in the funding statement below, the authors confirm that there are no known conflicts of interest associated with this publication and that there has been no financial support for this work that could have influenced its outcome. During the past 18 months, Dr Gupta has been compensated as a consultant by the MITRE Corporation for keynote addresses on telemedicine at a closed-door session to senior officials of department federal government agencies in Washington, D.C., McDermott Will Emery for a keynote address on the subject of artificial intelligence (AI) in Healthcare: The Role of Medical Boards at an event co-organized by the Federation of State Medical Boards, the Business Incubators Accelerators of The Saudi Technology Development and Investment Company (via MIT) for a globally live-streamed keynote address, co-organized by MIT Hacking Machine, on “Using Telemedicine and Artificial Intelligence to Provide Better Healthcare for All: Opportunities and Challenges” and by Walmart Health for work on Telemedicine and Telehealth.
Dr Amar Gupta is an employee of MIT and was partly funded from a research contract signed by Philips. Robyn Baek is a full-time employee of SOC Telemed.
| 1. | Gupta A, Goyal RK, Joiner KA, et al. Outsourcing in the healthcare industry: Information technology, intellectual property, and allied aspects. Inform Resour Manag J (IRMJ). 2008;21:1–26. https://doi.org/10.4018/irmj.2008010101 |
| 2. | Elson MJ, Stevenson EA, Feldman BA, et al. Telemedicine for Parkinson’s disease: Limited engagement between local clinicians and remote specialists. Telemed e-Health. 2018;24:722–4. https://doi.org/10.1089/tmj.2017.0210 |
| 3. | Saver JL. Time is brain—Quantified. Stroke. 2006;37:263–6. https://doi.org/10.1161/01.STR.0000196957.55928.ab |
| 4. | Mozaffarian D, Benjamin EJ, Go AS, et al. Executive summary: Heart disease and stroke statistics—2015 update: A report from the American Heart Association. Circulation. 2015;131:434–41. https://doi.org/10.1161/CIR.0000000000000157 |
| 5. | Fugate JE, Rabinstein AA. Absolute and relative contraindications to IV rt-PA for acute ischemic stroke. Neurohospitalist. 2015;5:110–21. https://doi.org/10.1177/1941874415578532 |
| 6. | Nguyen V-H, Wong BM, Shen DD, et al. Early management of acute ischemic stroke: Focus on IV tPA and timely reperfusion. U.S. Pharm. 2016:41(1):HS9–12. Available from: https://www.uspharmacist.com/article/early-management-of-acute-ischemic-stroke-focus-on-iv-tpa-and-timely-reperfusion |
| 7. | Capampangan DJ, Wellik KE, Bobrow BJ, et al. Telemedicine versus telephone for remote emergency stroke consultations: A critically appraised topic. Neurologist. 2009;15:163–6. https://doi.org/10.1097/NRL.0b013e3181a4b79c |
| 8. | Dall TM, Storm MV, Chakrabarti R, et al. Supply and demand analysis of the current and future US neurology workforce. Neurology. 2013;81:470–8. https://doi.org/10.1212/WNL.0b013e318294b1cf |
| 9. | Ahmed A, Jens W, Haulman A, et al. Neurology eConsults at Penn state health: What, why, and how? Telehealth Med Today. 2020. https://doi.org/10.30953/tmt.v5.158 |
| 10. | Busby L, Owada K, Dhungana S, et al. CODE FAST: A quality improvement initiative to reduce door-to-needle times. J Neurointervent Surg. 2016;8:661–4. https://doi.org/10.1136/neurintsurg-2015-011806 |
| 11. | Van Schaik SM, Scott S, de Lau LM, et al. Short door-to-needle times in acute ischemic stroke and prospective identification of its delaying factors. Cerebrovasc Dis Extra. 2015;5:75–83. https://doi.org/10.1159/000432405 |
| 12. | Kamal N, Holodinsky JK, Stephenson C, et al. Improving door-to-needle times for acute ischemic stroke: Effect of rapid patient registration, moving directly to computed tomography, and giving alteplase at the computed tomography scanner. Circ Cardiovasc Qual Outcomes. 2017;10:e003242. https://doi.org/10.1161/CIRCOUTCOMES.116.003242 |
| 13. | Jauch EC, Saver JL, Adams Jr HP, et al. Guidelines for the early management of patients with acute ischemic stroke: A guideline for healthcare professionals from the American Heart Association/American Stroke Association. Stroke. 2013;44:870–947. https://doi.org/10.1161/STR.0b013e318284056a |
| 14. | Adams RJ, Debenham E, Chalela J, et al. REACH MUSC: A telemedicine facilitated network for stroke: Initial operational experience. Front Neurol. 2012;3:33–3. https://doi.org/10.3389/fneur.2012.00033 |
| 15. | Harvey J, Al Kasab S, Almallouhi E, et al. Door to needle time and functional outcome for mild ischemic stroke over telestroke. J Telemed Telecare. 2019;25:365–9. https://doi.org/10.1177/1357633X18774460 |
| 16. | Rudolph SH, Levine SR. Telestroke, QALYs, and current health care policy: The Heisenberg uncertainty principle. AAN Enterprises; 2011. |
| 17. | Nelson HD, Fu R, Cantor A, et al. Effectiveness of breast cancer screening: Systematic review and meta-analysis to update the 2009 U.S. Preventive Services Task Force Recommendation. Ann Intern Med. 2016;164:244–55. https://doi.org/10.7326/m15-0969 |
| 18. | Nalleballe K, Sharma R, Brown A, et al. Ideal telestroke time targets: Telestroke-based treatment times in the United States stroke belt. J Telemed Telecare. 2018. https://doi.org/10.1177/1357633X18805661 |
| 19. | Wechsler LR. Advantages and limitations of teleneurology. JAMA Neurol. 2015;72:349–54. https://doi.org/10.1001/jamaneurol.2014.3844 |
| 20. | Yaghi S, Harik SI, Hinduja A, et al. Post t-PA transfer to hub improves outcome of moderate to severe ischemic stroke patients. J Telemed Telecare. 2015;21:396–9. https://doi.org/10.1177/1357633X15577531 |
| 21. | Pedragosa A, Alvarez-Sabin J, Molina CA, et al. Impact of a telemedicine system on acute stroke care in a community hospital. J Telemed Telecare. 2009;15:260–3. https://doi.org/10.1258/jtt.2009.090102 |
| 22. | Lyerly MJ, Wu T-C, Mullen MT, et al. The effects of telemedicine on racial and ethnic disparities in access to acute stroke care. J Telemed Telecare. 2016;22:114–20. https://doi.org/10.1177/1357633X15589534 |
| 23. | Soyiri IN, Reidpath DD. An overview of health forecasting. Environ Health Prevent Med. 2013;18:1. https://doi.org/10.1007/s12199-012-0294-6 |
| 24. | Brunner JO, Edenharter GM. Long term staff scheduling of physicians with different experience levels in hospitals using column generation. Health Care Manag Sci. 2011;14:189–202. https://doi.org/10.1007/s10729-011-9155-x |
| 25. | Blacquiere D, Lindsay MP, Foley N, et al. Canadian stroke best practice recommendations: Telestroke best practice guidelines update 2017. Int J Stroke. 2017;12:886–95. https://doi.org/10.1177/1747493017706239 |
| 26. | Araz OM, Bentley D, Muelleman RL. Using Google flu trends data in forecasting influenza-like-illness related ED visits in Omaha, Nebraska. Am J Emerg Med. 2014;32:1016–23. https://doi.org/10.1016/j.ajem.2014.05.052 |
| 27. | Aroua A, Abdul-Nour G. Forecast emergency room visits—A major diagnostic categories based approach. Int J Metrol Qual Eng. 2015;6:204. https://doi.org/10.1051/ijmqe/2015011 |
| 28. | Gul M, Guneri AF. Planning the future of emergency departments: Forecasting ed patient arrivals by using regression and neural network models. Int J Indust Eng. 2016;23. |
| 29. | Chase VJ, Cohn AE, Peterson TA, et al. Predicting emergency department volume using forecasting methods to create a “surge response” for noncrisis events. Acad Emerg Med. 2012;19:569–76. https://doi.org/10.1111/j.1553-2712.2012.01359.x |
| 30. | Peck JS, Gaehde SA, Nightingale DJ, et al. Generalizability of a simple approach for predicting hospital admission from an emergency department. Acad Emerg Med. 2013;20:1156–63. https://doi.org/10.1111/acem.12244 |
| 31. | McCarthy ML, Zeger SL, Ding R, et al. The challenge of predicting demand for emergency department services. Acad Emerg Med. 2008;15:337–46. https://doi.org/10.1111/j.1553-2712.2008.00083.x |
| 32. | Juang W-C, Huang S-J, Huang F-D, et al. Application of time series analysis in modelling and forecasting emergency department visits in a medical centre in Southern Taiwan. BMJ Open. 2017;7:e018628. https://doi.org/10.1136/bmjopen-2017-018628 |
| 33. | Xu Q, Tsui KL, Jiang W, et al. A hybrid approach for forecasting patient visits in emergency department. Qual Reliab Eng Int. 2016;32:2751–9. https://doi.org/10.1002/qre.2095 |
| 34. | Kadri F, Harrou F, Chaabane S, et al. Time series modelling and forecasting of emergency department overcrowding. J Med Syst. 2014;38:107. https://doi.org/10.1007/s10916-014-0107-0 |
| 35. | Afilal M, Yalaoui F, Dugardin F, et al. Forecasting the emergency department patients flow. J Med Syst. 2016;40:175. https://doi.org/10.1007/s10916-016-0527-0 |
| 36. | Butler M, Gu H, Kenney T, et al. P017: Does a busy day predict another busy day? A time-series analysis of multi-centre emergency department volumes. Can J Emerg Med. 2016;18:S83–4. https://doi.org/10.1017/cem.2016.193 |
| 37. | Rosychuk RJ, Youngson E, Rowe BH. Presentations to emergency departments for COPD: A time series analysis. Can Respir J. 2016;2016. https://doi.org/10.1155/2016/1382434 |
| 38. | Zinouri N, Taaffe KM, Neyens DM. Modelling and forecasting daily surgical case volume using time series analysis. Health Syst. 2018;7:111–19. https://doi.org/10.1080/20476965.2017.1390185 |
| 39. | Calegari R, Fogliatto FS, Lucini FR, et al. Forecasting daily volume and acuity of patients in the emergency department. Comput Math Methods Med. 2016;2016. https://doi.org/10.1155/2016/3863268 |
| 40. | Aboagye-Sarfo P, Mai Q, Sanfilippo FM, et al. A comparison of multivariate and univariate time series approaches to modelling and forecasting emergency department demand in Western Australia. J Biomed Inform. 2015;57:62–73. https://doi.org/10.1016/j.jbi.2015.06.022 |
| 41. | Bergs J, Heerinckx P, Verelst S. Knowing what to expect, forecasting monthly emergency department visits: A time-series analysis. Int Emerg Nurs. 2014;22:112–15. https://doi.org/10.1016/j.ienj.2013.08.001 |
| 42. | Salah H. Predicting inpatient length of stay in Western New York health service area using machine learning algorithms. Binghamton, NY: State University of New York; 2017. |
| 43. | Menke NB, Caputo N, Fraser R, et al. A retrospective analysis of the utility of an artificial neural network to predict ED volume. Am J Emerg Med. 2014;32:614–17. https://doi.org/10.1016/j.ajem.2014.03.011 |
| 44. | Zhang X, Kim J, Patzer RE, et al. Prediction of emergency department hospital admission based on natural language processing and neural networks. Methods Inform Med. 2017;56:377–89. https://doi.org/10.3414/ME17-01-0024 |
| 45. | Barak-Corren Y, Fine AM, Reis BY. Early prediction model of patient hospitalization from the pediatric emergency department. Pediatrics. 2017;139:e20162785. https://doi.org/10.1542/peds.2016-2785 |
| 46. | Greenland S, Mansournia MA, Altman DG. Sparse data bias: A problem hiding in plain sight. BMJ. 2016;352:i1981. https://doi.org/10.1136/bmj.i1981 |
| 47. | Hacke W, Kaste M, Bluhmki E, et al. Thrombolysis with alteplase 3 to 4.5 hours after acute ischemic stroke. N Engl J Med. 2008;359:1317–29. https://doi.org/10.1056/NEJMoa0804656 |
| 48. | Caso V, Paciaroni M, Agnelli G, et al. Gender differences in patients with acute ischemic stroke. Womens Health. 2010;6:51–7. https://doi.org/10.2217/WHE.09.82 |
| 49. | Broussalis E, Kunz A, Luthringshausen G, et al. Gender differences in patients with intravenous thrombolytic and conservative treatment for acute ischemic stroke. J Neurol Neurophysiol. 2011;2:117. https://doi.org/10.4172/2155-9562.1000117 |
| 50. | Sylaja P, Cote R, Buchan AM, et al. Thrombolysis in patients older than 80 years with acute ischaemic stroke: Canadian Alteplase for Stroke Effectiveness Study. J Neurol Neurosurg Psychiatry. 2006;77:826–9. https://doi.org/10.1136/jnnp.2005.086595 |
| 51. | Asplund K, Karvanen J, Giampaoli S, et al. Relative risks for stroke by age, sex, and population based on follow-up of 18 European populations in the MORGAM Project. Stroke. 2009;40:2319–26. https://doi.org/10.1161/STROKEAHA.109.547869 |
| 52. | Karagiannis A, Tziomalos K, Mikhailidis DP, et al. Seasonal variation in the occurrence of stroke in Northern Greece: A 10 year study in 8204 patients. Neurol Res. 2010;32:326–31. https://doi.org/10.1179/174313208X331608 |
| 53. | Magalhães R, Silva MC, Correia M, et al. Are stroke occurrence and outcome related to weather parameters? Results from a population-based study in northern Portugal. Cerebrovasc Dis. 2011;32:542–51. https://doi.org/10.1159/000331473 |
| 54. | SOC Telemed. CarolinaEast improving stroke care with teleNeurology. 2019, December 19. [cited 2020 Apr 21]. Available from: https://www.soctelemed.com/wp-content/uploads/2019/12/CarolinaEast-improving-stroke-care-with-teleNeurology.pdf |
| 55. | Fares A. Winter cardiovascular diseases phenomenon. N Am J Med Sci. 2013;5:266. https://doi.org/10.4103/1947-2714.110430 |
| 56. | Massachusetts General Hospital. TeleNeurology-clinical coverage. Massachusetts General Hospital; 2014. |
| 57. | Cadilhac DA, Vu M, Bladin C. Experience with scaling up the Victorian Stroke Telemedicine programme. J Telemed Telecare. 2014;20:413–18. https://doi.org/10.1177/1357633X14552389 |
| 58. | A review of physician-to-population ratios. [cited 2019 Apr 20]. Available from: http://www.maprainc.org/wp-content/uploads/2015/06/Physician-to-Population-Ratios-2013.pdf |
| 59. | Pan American Health Organization (PAHO). Chapter 4 public policies and health systems and services. In Health in the Americas. 2 vol. Washington, DC: PAHO, 2007; p. 302. |
| 60. | Nelson RE, Saltzman G, Skalabrin E, et al. The cost-effectiveness of telestroke in the treatment of acute ischemic stroke. Neurology. 2011;77:1590–8. https://doi.org/10.1212/WNL.0b013e318234332d |
| 61. | Demaerschalk BM, Berg J, Chong BW, et al. American telemedicine association: Telestroke guidelines. Telemed e-Health. 2017;23:376–89. https://doi.org/10.1089/tmj.2017.0006 |
| 62. | Ordu M, Demir E, Tofallis C. A comprehensive modelling framework to forecast the demand for all hospital services. Int J Health Plann Manag. 2019. https://doi.org/10.1002/hpm.2771 |
| 63. | Kepplinger J, Barlinn K, Deckert S, et al. Safety and efficacy of thrombolysis in telestroke: A systematic review and meta-analysis. Neurology. 2016;87:1344–51. https://doi.org/10.1212/WNL.0000000000003148 |
| 64. | Hess DC, Wang S, Hamilton W, et al. REACH: Clinical feasibility of a rural telestroke network. Stroke. 2005;36:2018–20. https://doi.org/10.1161/01.STR.0000177534.02969.e4 |
| 65. | Al Kasab S, Orabi MY, Harvey JB, et al. Rate of symptomatic intracerebral hemorrhage related to intravenous tPA administered over telestroke within 4.5-hour window. Telemed e-Health. 2018;24:749–52. https://doi.org/10.1089/tmj.2017.0248 |
| 66. | Wechsler LR, Tsao JW, Levine SR, et al. Teleneurology applications: Report of the Telemedicine Work Group of the American Academy of Neurology. Neurology. 2013;80:670. https://doi.org/10.1212/WNL.0b013e3182823361 |
Copyright Ownership: This is an open access article distributed in accordance with the Creative Commons Attribution Non Commercial (CC BY-NC 4.0) license, which permits others to distribute, adapt, enhance this work non-commercially, and license their derivative works on different terms, provided the original work is properly cited and the use is non-commercial. See: http://creativecommons.org/licenses/by-nc/4.0.