Jessica Navratil-Strawn1, Stephen Hartley2, Stephanie MacLeod3 and Andrew Lindsay4
Affiliations: 1Director of Healthcare Economics, Optum, Minneapolis, MN, USA; 2Senior Director of Healthcare Economics, Optum, Minneapolis, MN, USA; 3Research for Aging Populations, Optum, Ann Arbor, MI, USA; 4Senior Director of Product, Optum, Minneapolis, MN, USA
Corresponding Author: Jessica Navratil-Strawn, Jessica.navratil-strawn@optum.com
Keywords: Advocacy, Customized Advocacy, Healthcare Advisor
Section: Original Clinical Research
Background: The complexity of today’s healthcare system has led to the growth of an emerging healthcare function known as healthcare advocacy. A telephonic healthcare advocate or advisor can play an essential role in care coordination, a better understanding of health benefits, and ease in navigating the healthcare system. A healthcare advocate’s role may be filled by clinical staff (i.e., registered nurses), non-clinical staff, or both, with varying levels of training depending on the intended scope of service.
Objective: With a higher number of employers seeking customized health advocacy programing, this study serves to determine if more favorable healthcare outcomes offset the additional operating costs associated with a more dedicated delivery system. Therefore, this study’s primary objective was to evaluate the impact of patient access to a customized health advocacy program on downstream medical costs and healthcare utilization compared to a control (CON) group without access to this service. The secondary aim was to provide information to employers on whether a higher investment in a more complex customized delivery model provides significant value compared to a less customized program.
Methods: The study treatment (TRT) group included 89,372 individuals with access to a customized advocacy program for employees, while the CON group of 115,465 had access to a non-customized program. Key outcomes included total healthcare expenditures, hospital admissions, emergency room visits, and physician office visits 12 months after the advocacy start date compared to 6 months before the start date. Researchers evaluated the impact the customized advocacy intervention had on expenditures by comparing differences in pre- and post-expenditures between customized health advisor and non-customized health advisor groups after controlling for various demographic, socioeconomic, and health status characteristics. Inverse propensity score weighting helped minimize differences in characteristics between the TRT and CON groups.
Results: With the customized advocacy product, healthcare expenditures increased by only $2.03 per member per month (PMPM) compared with a $26.35 PMPM larger increase for controls with a non-customized product. Also, customized health advisor participants experienced reduced hospital admissions and ER visits compared with the CON group.
Conclusions: Study participants with access to customized healthcare advocacy services experienced significant healthcare cost savings, along with fewer ER visits, and reduced inpatient admissions compared with the CON group. Thus, these findings suggest that healthcare advocacy programs justify the increased delivery cost and can lead to reduced healthcare costs and utilization, along with the potential to improve health outcomes and quality of life.
In recent years, the healthcare system has become more complex, requiring increasing knowledge, skills, and capability among healthcare consumers to manage and direct their care, treatment options, and costs. The increasing complexity of the healthcare system has led to the development of an emerging healthcare function known as healthcare advocacy,1 where clinical and nonclinical advisors help consumers manage their health care and handle interactions with providers, insurance companies, and other entities. Healthcare advocates are healthcare professionals who can provide support in navigating the healthcare system, sometimes offered as part of a health insurance plan for an additional fee.1 Health advocates receive extensive training to address healthcare benefits questions, administrative claims issues, explain complex medical claim terminology, close healthcare treatment gaps for chronically ill populations, and provide primary care physician referrals. For individuals who would benefit from longer-term management, advanced nurse advisors even connect callers with a personal condition management nurse or wellness coach program to address health concerns.2
Several organizations and health insurance providers sponsor telephonic healthcare advocate or advisory products, programs, and resources, primarily for employees to better manage chronic and acute diseases and navigate the complex healthcare system.3–7 Some organizations offer case management to individuals with chronic illnesses and guidance in patient-focused health care.3 Through these programs, telephonic case managers advocate on their patients’ behalf and help them gain access to healthcare providers, including treatments, therapies, and medications. Other advocacy programs focus on helping older adults navigate their care management by facilitating independent living, physical health, and social connectedness.4 Healthy aging resources are also delivered by advocates through wellness programs and home safety assessments to prevent increased healthcare utilization over time.4 Elsewhere, trained advocates also provide individualized advocacy assistance by communicating with patients, their families, and their healthcare providers to coordinate care, develop action plans, and guide informed decisions.5 In totality, these advisory programs have the common goal of guiding patients telephonically to improve health and make it easier to navigate the healthcare system.
Currently, published research specifically describing healthcare advocates’ role is limited but instead focuses on a comparable operational approach known as a patient advisor module. Telephonic patient advocacy is expanding as a healthcare system process to reduce barriers and access to care, close gaps in care, and improve healthcare communications and service delivery.2 Patient advisors are like healthcare advocates, given they are trained to help patients with care coordination, provider communications, access to care, health insurance, and efficient advocacy of healthcare services.2 A recent review of patient advisor systems and services concluded that telephonic patient advocacy plays an essential role in care coordination, along with a better understanding of health insurance among patients.2 Thus, a patient advocate’s role is becoming increasingly important in today’s constantly changing healthcare system.
Also, there is some evidence suggesting that patient advocates can be beneficial in improving patients’ healthcare experiences and supporting better health outcomes. As an example, research by Sharma et al.8 evaluated patient advisory programs utilizing patient peers to support healthcare engagement and advocacy. The review conducted a meta-analysis to identify studies where telephonic patient advisors were influential in contributing to patients’ engagement in their care and described the challenge of evaluating outcomes of patient advisor programs.8
Elsewhere, related research has described various patient advocate programs and interventions as a feasible approach to supporting patients and improving their interactions with the healthcare system.9–12 As an example, one recent study conducted by the New Hampshire Colorectal Cancer Screening Program evaluated the efficacy of a colorectal cancer screening program’s patient advocacy program, a telephonic intervention in which advisors provided outreach to low-income patients (N = 443) to support cancer screening.13 Results showed that among the 443 patients who received advocacy, 97% completed their colonoscopies on time, with no missed appointments and less than 1% cancellations.13 Furthermore, advisors found benefits using a real-time data system, allowing for better communication and documentation during the study.
Meanwhile, a recent clinical effectiveness trial evaluated a patient advocacy program, Patient Advisor to Reduce Readmissions (PArTNER).14 This study compared the advisor intervention, including community health worker hospital and post-discharge visits and phone-based peer coaching, versus routine discharge care for various conditions.14 Results indicated that the PArTNER program supported the early and continued engagement of patients and their caregivers and providers. Finally, with the rapidly shifting and growing needs of many patients since the start of the COVID-19 pandemic, various quickly emerging programs have adapted patient advocacy programs for the current pandemic to best support individuals.15,16 In one case, an advocacy product created an online self-assessment application for patients in response to the COVID-19 environment to help with symptom assessment and provide important health information for patients in need.16
Nevertheless, given the limited information relating to the influence advocacy services have on patient behavior, this paper will examine the impact that a more customized, telephonic healthcare advocacy program had on downstream medical and utilization behaviors for members with access to these services.
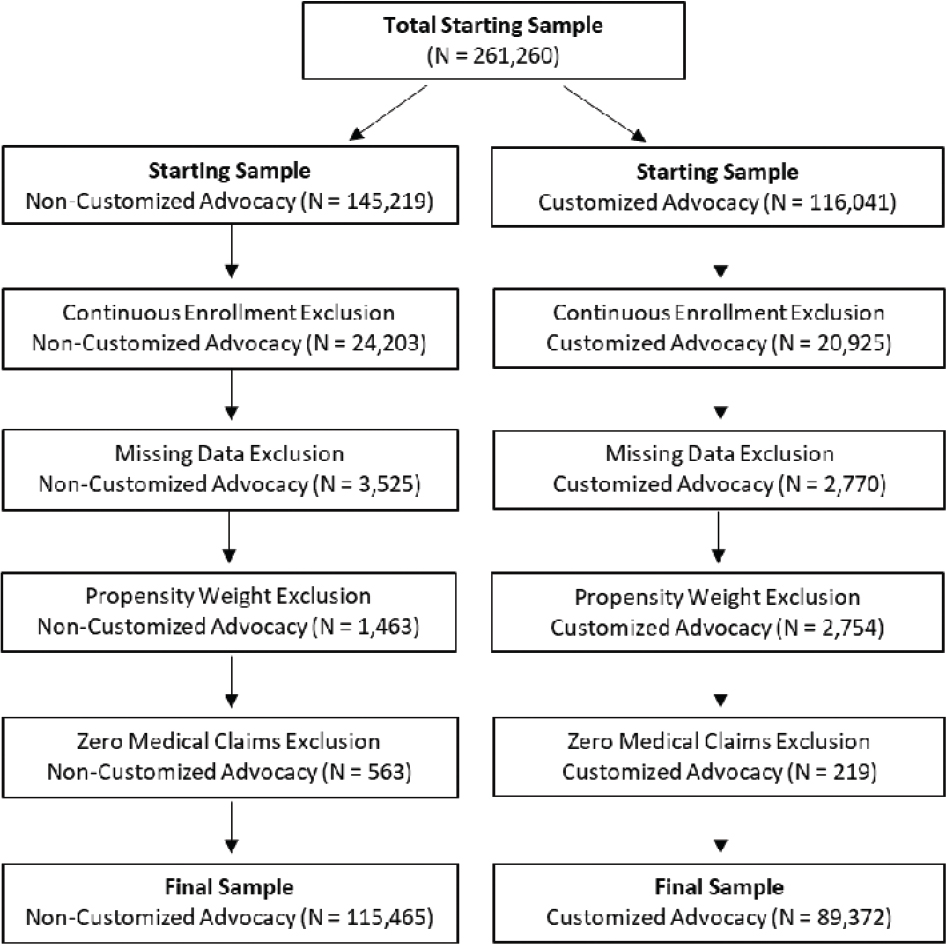
The current study included 204,837 employees and dependents enrolled with an employer group insurance policy between August 1, 2015 and January 1, 2017. Treatment (TRT) group individuals (n = 89,372) included members with access to customized, telephonic health advisory services, while the CON group members (n = 115,465) had availability to a less customized, telephonic advocacy product. Most interactions were provided by phone, with <2% of interactions currently handled by email, digital applications, or online chat, while the remaining 98% of volume is telephonic communication. As shown in Figure 1, study authors applied several standard exclusion criteria before studying the effectiveness of the program to improve validity. Individuals without evidence of continuous medical coverage in the 3 months before and 9 months after the advocacy start date were excluded (N = 24,203 non-customized; N = 20,925 customized). For adjusting for case-mix differences, any members with missing demographic, socioeconomic, geographic location, or health status variables used in inverse propensity weighting were omitted from the study (N = 3,525 non-customized; N = 2,770 customized). Statisticians removed cases with propensity score outliers (N = 1,463 non-customized; N = 2,754 customized) as they would influence study outcomes. Finally, exclusions of individuals with zero or very low healthcare expenditures ensured the analysis focused on members utilizing the healthcare system (N = 563 non-customized; N = 219 customized).
Figure 1—Study exclusion waterfall.
Table 1 provides an overview of the services provided by the customized versus non-customized advocacy products under observation in this study. At a high level, members with access to customized advocacy receive access to triage care recommendations, decision support navigation, health education assistance, program referrals, member information (benefit/claims support), and provider/facility searches. Triage services offer 24-hour inbound registered nurse advocate support to help direct patients to the most appropriate level or site of care for their acute and chronic problems. Decision support services include registered nurse advocate discussing treatment options for musculoskeletal conditions and providing provider searches to get second opinions for surgical-related treatments. Triage and decision support services under the customized model are available to all members regardless of the member’s health risk profile. Health education services involve registered nurse advocates discussing health conditions, gaps in healthcare treatment, and medication adherence protocols with callers. Registered nurse advocates handling health education requests also answer questions about chronic or complex conditions and even introduce members to a personal condition management nurse or wellness coach for ongoing support through clinical program referrals. For callers who would benefit from longer-term management, registered nurse advocates and nonclinical advocates provide members with warm transfers to case management, disease management, wellness, or women’s health nurses for ongoing support. Customized nonclinical advocates handle member information requests by answering questions related to benefits, claims issues, or complex medical claim terminology. This service is solely provided by nonclinical advocates with no option for transferring to a registered nurse advocate. Finally, customized advocacy service providers are not involved in the prior authorization process for any medical treatment receipt. Being an independent resource for providing care recommendations helps reassure participants the program’s goal is not preventing them from receiving necessary services, but rather the clinical teams steer them to the most effective care based on presenting symptoms.
Table 1. Product service overview for customized versus non-customized advocacy programs
| Service type | Service description | Non-customized delivery | Customized delivery |
|---|---|---|---|
| Prior authorization | Conducts prior authorization for high-cost procedures and services, such as IP admissions and surgical procedures | Service provided: Yes Advocate type: Registered nurse |
Service provided: No |
| Member information: benefits and claims support | Helps callers with benefits and claims questions related to explanation of benefits and medical treatment coverage | Service provided: Yes Advocate type: Nonclinical agent |
Service provided: Yes Advocate type: Nonclinical agent |
| Program referrals to case/disease management programs | Advocates identify whether members would benefit from clinical programs, such as disease or case management while on phone with callers | Service provided: Yes, but for low-risk members nonclinical agents schedule an appointment with registered nurse for a call back. Advocate type:
|
Service provided: Yes, includes warm transfers to appropriate program occur. Advocate type:
|
| Provider and facility searches | Provides members with help on searching for quality providers and facilities | Service provided: Yes Advocate type:
|
Service provided: Yes Advocate type:
|
| Health education | Advocate discuss health conditions, gaps in healthcare treatment, and medication adherence protocols | Service provided: Yes, but it is limited to only high-risk callers Advocate type:
|
Service provided: Yes, provided to all callers regardless of health risk profile Advocate type:
|
| Triage services | Assists callers with acute/chronic conditions to find the appropriate level of care based on presenting symptoms | Service provided: No |
Service provided: Yes Advocate type:
|
| Decision support | Includes nurse assistance with discussing treatment options for musculoskeletal conditions and getting second opinions for surgical-related treatment protocols | Service provided: Yes, but it is limited to only high-risk callers Advocate type:
|
Service provided: Yes Advocate type:
|
Members with a non-customized advocacy product have the same member information support through nonclinical advocate. However, members with a non-customized advocacy product do not have access to registered nurse advocates for 24-hour triage services or decision support navigation with the exception of clinically high-risk members for decision support navigation. High-risk members include anyone with a complex condition (i.e., hemophilia, HIV/AIDS, multiple sclerosis, or cystic fibrosis), history of frequent inpatient (IP) admissions or emergency room (ER) utilization (i.e., two or more in last 6 months), or evidence of high-cost medical expenditures (i.e., $50,000 or more in past year). Another difference in operational delivery is health education from registered nurse advocates is only provided to high-risk members under the non-customized product, while the customized product opens this service up to all callers regardless of health risk profile. Also, although program referrals to disease and case management programs are provided through the non-customized program, there is no warm transfer made to these clinical management programs. Instead, nonclinical advocates schedule appointments to connect these members to clinical programs later. Provider/facility searches are only conducted by registered nurse advocates under the non-customized product if the member is high risk, while members with access to customized advocacy get access to this for all levels of health risk and can opt into using a registered nurse advocate to deliver this service. Lastly, members from the CON group also undergo utilization management or utilization review processes before receiving treatment for high-cost procedures and services. This perceived gateway between the advocate and receipt of care often leaves callers users frustrated, which subsequently disrupts trust between advocates and the member due to a lack of independence between the program and health insurance plan. Members with access to the customized advocacy product do not have to undergo prior authorization prior to receipt of the same medical treatments.
Health status measures were also included in the analyses to adjust for baseline differences between the TRT and CON groups using demographic characteristics, health status, and disease indicators. Demographic measures included age, gender (assessed via eligibility records), and location (census region of the country based on member’s zip code). During the 6-month pre-index period, health status evaluation involved determining the count of IP stays and ER visits. A paid-to-allowed medical expenditure ratio adjusted for differences in employer benefit structure. This ratio ranges from 0 to 1 and compares the number of dollars the health plan pays relative to the health plan payment plus deductible, copayment, and coinsurance. Lastly, disease indicators helped adjust for high medical costs associated with the following diseases: hypertension, depression, heart failure, pulmonary disease, vascular disease, and diabetes.
The key outcomes included total healthcare costs, hospital admissions, ER visits, and physician office visits in the 6 months before and 12 months after advocacy start date using a difference-in-difference (DID) approach. Total costs included the sum of all medical and pharmacy costs on a per-member-per-month (PMPM) basis, including health plan and member paid amounts.
Index dates were defined for each individual to divide observed time frames into two periods (before vs. after the member’s advocacy start date) to understand how healthcare expenditures changed over time for both the TRT and CON groups. The index date for all study participants was the date their employers started offering advocacy services to members.
This retrospective cohort study used inverse propensity weighting to evaluate the effectiveness of a more customized advocacy product on healthcare expenditure and medical utilization trends for large employers. Researchers divided eligible study group members (n = 204,837) into two participant cohorts based on access to a customer advocacy product:
Impact on healthcare expenditures was evaluated by comparing the difference in pre- and post-PMPM expenditures between customized health advocacy and non-customized health advocacy groups. To remove case-mix bias, researchers controlled for various demographic, health status, and utilization characteristics (i.e., age, gender, income, disease indicators, paid-to-allowed ratio, and healthcare utilization) using inverse propensity weighting adjustment. The inverse propensity weight helps adjust for unbalanced baseline covariates between study group participants before looking at study outcomes.
Inverse propensity weighting minimized differences in demographics, health status, medical utilization, and socioeconomic characteristics between the TRT and CON groups. The first step in applying the inverse propensity weighting technique involves building a multinomial propensity weight to determine the propensity score. The propensity score was derived by logistic regression modeling, using members’ demographics, health status (including pre-index healthcare costs), and other defined characteristics as adjustment variables. The propensity score (on a scale of 0–1) is the probability of each subject’s exposure to a more customized advocacy product conditional on observed covariates before member status assignment. Each member’s propensity score involved creating a case weight for subsequent regression analysis, calculating the weight by dividing 1.0 by the member’s propensity score value. Researchers reviewed multiple collinearities of adjustment variables using the variance inflation factor and condition index values for each variable. This statistical check involved removing any variables with a variance inflation factor ≥10 or condition index ≥30 from the propensity weighted regression model.
Differences in demographic and health status characteristics between customized advocacy members and non-customized advocacy members were measured using Pearson’s chi-square test, the Mann–Whitney test, Student’s t-test, or analysis of variance (ANOVA), as appropriate. Correlation between variables was analyzed using Pearson’s correlation coefficient, and multicollinearity of variables was measured using a variance inflation factor. Statisticians used propensity score weighted outcomes with a fixed effect generalized linear model (GLM), with a gamma distribution and log-link using Proc Genmod to estimate the impact of customized health advocacy services on healthcare expenditures and medical utilization. The GLM model included the study group, time, and study group/time interaction variable. Time and interaction between time and study group were added to outcome models to adjust for within-subject correlation. All statistical tests used two-sided p-values with a 0.05 threshold and 95% confidence intervals. SAS software, version 9.4, was used for carrying out the analysis.
Advocacy services function as an inbound model, so patients do not really “accept” service levels. Instead, they call in to inquire about a specific disease, need assistance on treatment options, or need benefit/claims questions answered. Overall, researchers could not obtain the frequency and distribution of utilization by service type for the CON group (non-customized advocacy), but researchers were given a high-level information, showing that total advocacy utilization for the non-customized product averaged 8.1% (unique users/total population with access to services) per year or 1.3 services per member. For the customized group, approximately 22% of unique individuals utilized at least one advocacy service in a calendar year. Of the 22% using customized advocacy, there was an average of 3.5 services used per member. The distribution of services provided for customized advocacy was 68.5% health information (benefit/claims), 25.2% program referrals, 3.1% triage, 1.5% provider/facility searches, 1.3% health education information, and 0.4% decision support. This information shows that unique members with access to customized advocacy are 2.72 times more likely to use the product compared to the non-customized product.
Table 2 shows mean values of the demographic and health status measures for both groups, before and after applying propensity weighting. Standardized differences (Std Diff) greater than 0.100 indicate significant differences in characteristics between the TRT and CON groups. Before applying propensity score weighting, there were significant differences in the mean age (MTRT = 35.25 years, MCON = 39.84 years, Std Diff = 0.243), hypertension prevalence (MTRT = 14.47%, MCON = 19.28%, Std Diff = 0.129), members living in western region (MTRT = 14.87%, MCON = 20.80%, Std Diff = 0.155), and pre-customized advocacy hospital visits per person (MTRT = 1.91, MCON = 4.48, Std Diff = 0.129) between customized health advocacy and non-customized health advocacy individuals. The application of inverse propensity weighting was effective at removing all measured case-mix differences given the Std Diff was less than 0.10 for all independent variables. This statistical technique allowed program impact to be estimated more accurately as case-mix differences no longer influenced the results.
Table 2. Demographic characteristics by study group
| Variable | Unweighted: Mean(SD) | Weighted: Mean(SD) | ||||
| Customized | Non-Customized | Standardized Difference | Customized | Non-Customized | Standardized Difference | |
|---|---|---|---|---|---|---|
| Age | 35.25 (SD=17.58) | 39.84 (SD=19.90) | 0.543 | 37.05 (SD=17.58) | 38.21 (SD=19.90) | 0.071 |
| Gender (% female) | 51.47 (SD=0.50) | 47.91 (SD=0.50) | 0.071 | 50.96 (SD=0.50) | 48.74 (SD=0.50) | 0.044 |
| Atrial Fibrillation (%) | 0.35 (SD=0.06) | 0.59 (SD=0.09) | 0.036 | 0.41 (SD=0.09) | 0.52 (SD=0.10) | 0.016 |
| Coronary Artery Disease (%) | 1.00 (SD=0.11) | 1.63 (SD=0.13) | 0.055 | 1.10 (SD=0.13) | 1.37 (SD=0.15) | 0.024 |
| Cerebralvascular Disease (%) | 0.24 (SD=0.05) | 0.40 (SD=0.06) | 0.028 | 0.26 (SD=0.06) | 0.33 (SD=0.07) | 0.013 |
| Depression (%) | 3.67 (SD=0.20) | 4.71 (SD=0.20) | 0.052 | 3.63 (SD=0.20) | 4.55 (SD=0.20) | 0.046 |
| Diabetes (%) | 4.41 (SD=0.22) | 5.59 (SD=0.22) | 0.054 | 4.44 (SD=0.22) | 4.93 (SD=0.23) | 0.023 |
| Epilepsy (%) | 0.50 (SD=0.07) | 0.49 (SD=0.07) | 0.001 | 0.46 (SD=0.07) | 0.49 (SD=0.07) | 0.005 |
| Hypertension (%) | 14.47 (SD=0.37) | 19.28 (SD=0.38) | 0.129 | 14.89 (SD=0.38) | 17.16 (SD=0.40) | 0.062 |
| Obesity (%) | 11.91 (SD=0.34) | 13.54 (SD=0.33) | 0.049 | 11.84 (SD=0.33) | 13.16 (SD=0.33) | 0.040 |
| Congestive Heart Disease (%) | 0.15 (SD=0.03) | 0.39 (SD=0.06) | 0.046 | 0.22 (SD=0.06) | 0.30 (SD=0.07) | 0.015 |
| Rheumatoid Arthritis (%) | 0.38 (SD=0.07) | 0.50 (SD=0.07) | 0.017 | 0.39 (SD=0.07) | 0.46 (SD=0.07) | 0.012 |
| Gender (% female) | 51.47 (SD=0.50) | 47.91 (SD=0.50) | 0.071 | 50.96 (SD=0.50) | 48.74 (SD=0.50) | 0.044 |
| WEST (%) | 14.87 (SD=0.37) | 20.80 (SD=0.37) | 0.155 | 18.75 (SD=0.37) | 17.63 (SD=0.38) | 0.029 |
| Emergency Room Visits / 1000 | 8.16 (SD=0.30) | 6.48 (SD=0.30) | 0.065 | 8.23 (SD=0.30) | 6.20 (SD=0.30) | 0.079 |
| Hospital Admissions / 1000 | 1.91 (SD=0.17) | 4.48 (SD=0.18) | 0.146 | 2.20 (SD=0.18) | 3.49 (SD=0.20) | 0.077 |
Note: Standard differences >=.100 indicate signficant differences between the customized and non-customzied advocacy cohorts
Table 3 includes the PMPM pre- and post-period expenditure results (after propensity weighting case-mix adjustment) for the fixed effects model design. The table calculates the change in PMPM medical expenditures by taking the post-period expenditures minus the pre-period values (i.e., post–pre change). The DID looks at the net difference between the study group by taking the post–pre change for customized advocacy members minus the non-customized cohort with negative values, indicating more favorable outcomes in the TRT group. The post–pre change in PMPM medical expenditures increased by only $2.03 for the customized advocacy cohort compared to $26.35 for the non-customized product (p = 0.004). This DID outcome indicates that PMPM medical expenditures increased by $24.35 less in the customized advocacy cohort than controls.
Table 3. Allowed medical expenditures and healthcare utilization
| Outcome | Non-Customized Advocacy | Customized Advocacy | Customized vs. Non-Customized | |||||
| Pre | Post | Post-Pre Change | Pre | Post | Post-Pre Change | Difference in Difference | Between Group p-value | |
|---|---|---|---|---|---|---|---|---|
| Medical PMPM | $ 385.34 | $ 411.72 | $ 26.38 | $ 376.61 | $ 378.64 | $ 2.03 | $ (24.35) | 0.004 |
| Pharmacy PMPM | $ 110.69 | $ 122.64 | $ 11.95 | $ 92.33 | $ 100.27 | $ 7.94 | $ (4.01) | <.001 |
| Hospital Admits / 1000 | 51.29 | 52.45 | 1.16 | 43.03 | 37.22 | (5.82) | (6.98) | 0.027 |
| Emergency Room Visits / 1000 | 224.72 | 229.57 | 4.85 | 217.82 | 196.07 | (21.76) | (26.61) | <.001 |
| Well-Care Visits / 1000 | 343.65 | 342.56 | (1.10) | 275.41 | 276.94 | 1.53 | 2.63 | 0.399 |
| Specialist Visits / 1000 | 1,686.14 | 1,879.21 | 193.07 | 1,568.36 | 1,706.53 | 138.17 | (54.90) | 0.337 |
For pharmacy expenditures, the customized health advisor cohort had a significantly lower post–pre increase of $7.94 in PMPM costs relative to a post–pre $11.95 rise in spending for the CON group, with the net DID showing the customized cohort increase $4.01 less (p < 0.001). Researchers hypothesize the increase in pharmaceutical expenditures for both cohorts relates to nonclinical services talking to members about improving medical adherence through better compliance with drug management. The customized health advisor cohort experienced 5.82 annualized visits per 1,000 members reduction in hospital admissions, while the non-customized health advisor group had 1.16 visits per 1,000 members increase. Looking at the DID IP admissions outcome, customized advocacy customers decreased admissions by 6.98 visits per 1,000 members more than controls (p = 0.027). Researchers observed similar findings for ER annualized visits per 1,000 members, with customized health advisor members reducing utilization by 21.8 annualized visits per 1,000 members, while the non-customized health advisor group increased by 4.85 annualized visits per 1,000 members. For measuring the ER DID difference, customized advocacy customers decreased ER visits by 26.61 visits per 1,000 members than controls (p < 0.001). Finally, there were no significant differences in the change of either well-care annualized visits per 1,000 members or specialist annualized visits per 1,000 members between the customized health advisor and non-customized health advisor groups. DID results for well-care annualized visits per 1,000 members (p = 0.399) and specialist annualized visits per 1,000 members (p = 0.337) were not significantly different between the study cohorts.
In this study, results showed that individuals with access to the customized health advisor experienced a more significant reduction in ER visits and IP admissions than those without access. We also found that those who had access to a customized health advisor service experienced a more significant reduction in post-period IP admissions than the non-customized health advisor cohort. Because ER and hospital readmissions are often positively correlated, there may be critical secondary benefits to be gained by reducing hospital readmissions. This evidence also suggests a more customized advocacy program may help individuals seek care in a more appropriate care setting. The availability of a more customized advocacy service was associated with medical expenditure and pharmacy savings, with customized health advisor members experiencing a $24 PMPM lower increase in medical costs and a $4 PMPM smaller rise in Rx claims after program implementation, compared with those who did not have the program available. Researchers hypothesize reductions in healthcare cost and utilization are likely be driven by 2.7 times more unique members using the customized advocacy services.
These findings align with those reported elsewhere regarding patient advocacy services. For instance, one patient advocacy service company has reported that their employer clients have seen approximately 3–5% savings in healthcare costs after 1 year of engagement in the model, with up to 15% savings after 5 years.6 However, in this case, there were weaknesses in the provider’s measurement methods, precisely due to the failure to control for prior period spending. As such, the CON group could have had a downward spending trend at the start, indicating more favorable results. Also, the sample size was small, bringing into question the generalizability to a broad customer base.6 However, results are encouraging nevertheless, as all variables were measured retrospectively, following the period of study, and the methods used only measurable claims and data from the census. Additionally, the methodology utilized in this example combined claims, biometrics, and healthcare data along with personal interactions to reach these results.
Similarly, another advocacy service provider has estimated that employer plans reflect member savings of approximately 12.5% in the third year of engagement.7 Again, the study provided little detail about the statistical methodology used in these findings; thus, it remains unclear whether there was adequate control for confounding factors that could ultimately have influenced study outcomes. Overall, a literature review of patient advisors from various studies demonstrated promise for the patient advisors’ role in supporting services that affect healthcare delivery and potential health outcomes.8 In the review, the authors concluded that patient advisors could help achieve enhanced patient engagement, experience with care, and overall care quality.8 In another study, patient advocates’ effectiveness and feasibility were explored, with advocates utilized to facilitate scheduling, insurance coverage, and implementation of physician directives.11 Results indicated that participants with a patient advocate showed the most potential for improved health outcomes and quality of life.11
Similar patient advocacy programs have shown potential, with a limited number of published studies suggesting successful outcomes resulting from their use. One literature review specifically described patient advocacy programs that connect primary care to community-based and social services for patients. In this review, the authors found that the advocacy programs realized positive outcomes for patients and providers, and advisors in supporting care delivery.12 However, study authors report results with the caution that most studies have been descriptive with limited proven evidence to support their findings.12
Overall, patient advocacy programs (i.e., healthcare advocacy programs) are considered to have an essential and growing role in the healthcare system by facilitating and coordinating care, bridge care gaps, and guide patients.17,18 Subsequently, patient advocacy can potentially lead to reduced costs and utilization, along with improved access and quality of care for consumers.17, 18 In some cases, patient advisors who assist those with specific chronic conditions have successfully guided patients’ care and treatment journeys. As one example, cancer patient advocacy programs have demonstrated increased access to care and improved utilization of necessary treatments.19 These programs are specifically tailored to support individuals with cancer and have helped resolve care barriers, improving treatment access, and disease outcomes in some cases.19 Similarly, patient advisors have been used in care coordination for high ER utilizers and increased utilization of needed mammography and colonoscopy services for those at increased risk.20,21 However, despite these examples, evidence of proven success with patient healthcare advisory programs remains limited,12,17,18 thus further work in this area is warranted.
Readers should interpret findings in the current study within the context of the study’s limitations and strengths. One limitation in this study was the use of medical claims data collected for insurance purposes rather than for research purposes, even though program evaluators frequently use administration data to measure healthcare interventions’ success. Second, this study did not include a control without access to any advocacy services. Having members without any advocacy service could have shown an incremental benefit to having a non-customized advocacy product versus no advocacy service. Finally, the pre- versus post-design ensured comparability when determining the effect of having a customized advocacy program, and propensity score weighting adjusted for measurable case-mix differences that existed between members with access to the customized advocacy service compared to no access to the service. However, there may have been confounding variables not controlled for in the analysis that could have affected outcome comparisons. Also, the inclusion of only a 6-month pre-period could have introduced seasonality concerns when comparing to a 12-month post-period. We attempted to control this by converting all outcome variables to PMPM metrics, but this may not have effectively removed a seasonality influence. However, this potential seasonality effect should be non-differential between the two study cohorts as it would affect both groups.
This study evaluated the impact of having access to a more customized advocacy product on downstream medical costs and utilization compared with a CON group without availability to this service. As shown in Table 3, individuals with access to customized health advisor services experienced significant medical expenditure savings, fewer ER visits, and reduced IP admissions than the non-customized health advisor cohort. These findings suggest that customized advocacy services result in favorable reductions in healthcare utilization and expenditures for members with access to the program that would justify the delivery model’s increased cost and complexity.
Ms. Navratil-Strawn, Ms. MacLeod, Mr. Lindsay, and Mr. Hartley declared the following conflicts of interest with respect to the research, authorship, and/or publication of this article: All authors are paid employees of their respective organizations. In addition, Ms. Navratil-Strawn, Ms. MacLeod, Mr. Lindsay, and Mr. Hartley have stock options with UnitedHealth Group. The other authors have no other conflicts of interest to report. This work was funded by Optum. The investigators retained full independence in the conduct of study design, data collection and analysis, decision to publish, or preparation of the manuscript.
| 1. | Johns Hopkins Medicine. The power of a health care advocate. Copyright © 2019 The Johns Hopkins University, The Johns Hopkins Hospital, and Johns Hopkins Health System. Available at: https://www.hopkinsmedicine.org/health/wellness-and-prevention/the-power-of-a-health-care-advocate. Accessed December 2019. |
| 2. | Carter N, Valaitis RK, Lam A, Feather J, Nicholl J, Cleghorn L. Advocacy delivery models and roles of advisors in primary care: A scoping literature review. BMC Health Serv Res. 2018;18:96. https://doi.org/10.1186/s12913-018-2889-0 |
| 3. | Patient Advocate Foundation. Our mission. Available at: https://www.patientadvocate.org/learn-about-us/out-history/. Accessed December 2019. |
| 4. | Health Advocates for Older People. Mission and background. Available at: www.hafop.org/mission.htm. Accessed December 2019. |
| 5. | SENIORx Patient Advocates. Available at: www.seniorpatientadvocates.com. Accessed December 2019. |
| 6. | Accolade website. Driving healthcare savings and satisfaction. Available at: www.accolade.com. Accessed December 2019. |
| 7. | Quantum Health website. Copyright © 2019 Quantum health. Available at: https://quantum-health.com/. Accessed December 2019. |
| 8. | Sharma AE, Knox M, Mleczko VL, Olayiwola N. The impact of patient advisors on healthcare outcomes: A systematic review. BMC Health Serv Res. 2017;17:693. https://doi.org/10.1186/s12913-017-2630-4 |
| 9. | Apter AJ, Morales KH, Han X, Perez L, Huang J, Ndicu G, et al. A patient advocate to facilitate access and improve communication, care, and outcomes in adults with moderate or severe asthma: Rationale, design, and methods of a randomized controlled trial. Contemp Clin Trials. 2017;56:34–45. https://doi.org/10.1016/j.cct.2017.03.004 |
| 10. | Efanov JI, Papanastasiou C, Arsenault J, Moreau M, Pomey MP, Higgins J, et al. Contribution of patient-advisors during rehabilitation for replantation of digits improves patient-reported functional outcomes: A presentation of concept. Hand Surg Rehabil. 2018. S2468-1229(18)30060-4. |
| 11. | Apter AJ, Wan F, Reisine S, Bogen DK, Rand C, Bender B, et al. Feasibility, acceptability and preliminary effectiveness of patient advocates for improving asthma outcomes in adults. J Asthma. 2013;50(8):850–60. https://doi.org/10.3109/02770903.2013.812655 |
| 12. | Valaitis RK, Carter N, Lam A, Nicholl J, Feather J, Cleghorn L. Implementation and maintenance of patient advocacy programs linking primary care with community-based health and social services: A scoping literature review. BMC Health Serv Res. 2017;17:116. https://doi.org/10.1186/s12913-017-2046-1 |
| 13. | DeGroff A, Gressard L, Glover-Kudon R, Rice K, Tharpe FS, Escoffery C, et al. Assessing the implementation of a patient advocacy intervention for colonoscopy screening. BMC Health Serv Res. 2019;19:803. https://doi.org/10.1186/s12913-019-4601-4 |
| 14. | Prieto-Centurion V, Basu S, Bracken N, Calhoun E, Dickens C, DiDomenico RJ, et al. Design of the patient advisor to reduce readmissions (PArTNER) study: A pragmatic clinical effectiveness trial. Contemp Clin Trials Commun. 2019;15:100420. https://doi.org/10.1016/j.conctc.2019.100420 |
| 15. | Raeside R, Partridge SR, Singleton A, Redfern J. Cardiovascular disease prevention in adolescents: eHealth, co-creation, and advocacy. Med Sci. 2019;7:34. https://doi.org/10.3390/medsci7020034 |
| 16. | Fassihi F. Thrive health: A new venture connecting patient advocacy to well-being. Int J Commun Well-Being. 2020;12:1–4. https://doi.org/10.1007/s42413-020-00065-8 |
| 17. | Natale-Pereira A, Enard KR, Nevarez L, Jones LA. The role of patient advisors in eliminating health disparities. Cancer. 2011;117(150):3543–52. https://doi.org/10.1002/cncr.26264 |
| 18. | Ramsey S, Whitley E, Mears VW, McKoy JM, Everhart RM, Caswell RJ, et al. Evaluating the cost-effectiveness of cancer patient advocacy programs: Conceptual and practical issues. Cancer. 2009;115(23):5394–403. https://doi.org/10.1002/cncr.24603 |
| 19. | Braun KL, Kagawa-Singer M, Holden AEC, Burhansstipanov L, Tran JH, Seals BF, et al. Cancer patient advisor tasks across the cancer care continuum. J Health Care Poor Underserved. 2012;23(1):398–413. https://doi.org/10.1353/hpu.2012.0029 |
| 20. | Seaberg D, Elseroad S, Dumas M, Mendiratta S, Whittle J, Hyatte C, et al. Patient advocacy for patients frequently visiting the emergency department: A randomized, controlled trial. Acad Emerg Med. 2017;24(11):1327–33. https://doi.org/10.1111/acem.13280 |
| 21. | Slater JS, Parks MJ, Nelson CL, Hughes KD. The efficacy of direct mail, patient advocacy, and incentives for increasing mammography and colonoscopy in the medicaid population: A randomized controlled trial. Cancer Epidemiol Biomarkers Prev. 2018;27(9):1047–56. https://doi.org/10.1158/1055-9965.EPI-18-0038 |
Copyright Ownership: This is an open access article distributed in accordance with the Creative Commons Attribution Non Commercial (CC BY-NC 4.0) license, which permits others to distribute, adapt, enhance this work non-commercially, and license their derivative works on different terms, provided the original work is properly cited and the use is non-commercial. See: http://creativecommons.org/licenses/by-nc/4.0.